


Correct option is B
To conduct a chi-square test for association between two categorical variables, the correct sequence of steps is:
1. E. Tabulate the observed cell frequencies in a 2x2 contingency table: This is the first step to organize the raw data by putting observed frequencies into a table.
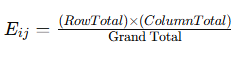
2. A. Calculate the expected cell frequencies: Calculate the expected frequency for each cell using the formula:
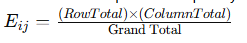
3. B. Calculate the value of (Oi – Ei)²/Ei across all cell frequencies and add them: This step involves calculating the chi-square statistic. The formula is:
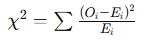 where Oi is the observed frequency and Ei is the expected frequency.
4. C. Compare the calculated chi-square statistic with the critical value: Compare the obtained chi-square statistic with the critical value from a chi-square distribution table at 1 degree of freedom (for a 2x2 table).
5. D. Reject or accept the Null Hypothesis based on the analysis: If the calculated chi-square statistic exceeds the critical value, reject the Null Hypothesis; otherwise, fail to reject it.
Information Booster:
1.
Chi-Square Test:
· Used to test for independence between two categorical variables.
· Null Hypothesis (H₀): The variables are independent.
· Alternative Hypothesis (H₁): The variables are associated.
2.
Contingency Table:
· A matrix used to display the frequency distribution of categorical variables.
3.
Expected Frequency:
· Derived using the formula:
· The critical value depends on the significance level (commonly 0.05) and degrees of freedom (df).
· For a 2x2 table, df = 1.
4.
Degrees of Freedom:
· Formula for df in contingency tables: (r−1)(c−1), where rrr = number of rows, ccc = number of columns.
Additional Knowledge:
·
Types of Chi-Square Tests:
·
Goodness of Fit Test: Determines if a sample fits a population distribution.
·
Test of Independence: Checks the association between two categorical variables.
·
Conditions for Validity:
· All expected frequencies should be ≥5 for the chi-square test to be valid.
·
Interpretation:
· A higher chi-square value indicates a stronger deviation from independence, suggesting a significant association.
 English
 10 Questions
 20 Marks
 12 Mins
