arrow
arrow
arrow
A company has six departments. The given bar graph represents the number of employees in each department during the years 2015 and 2018. The company h
Question

A company has six departments. The given bar graph represents the number of employees in each department during the years 2015 and 2018. The company hired 80 new employees between 2015 and 2018 and also laid off some employees. All the employees who were laid off were from Department C. If the employees of Department C had not been laid off, the number of employees in Department C in 2018 would have been ______ more.

A.

10%

B.

17.5%

C.

20%

D.

12.5%

Correct option is D

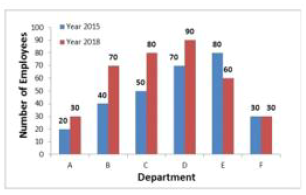
Total number of employees in all departments in 2015:

20+40+50+70+80+30 = 290

Total number of employees in all departments in 2018:

30+70+80+90+60+30 = 360

Difference in total employees between 2015 and 2018:

360 – 290 = 70

According to the question, the number of employees added =80

Employees fired from Department C:

80 – 70 = 10

Actual strength of Department C in 2018 (Given) = 80

If no employees were fired, the strength of Department C in 2018 would have been:

80+10 = 90

Percentage by which the strength of Department C in 2018 would have been greater:

(10/80)×100 = 12.5%

test-prime-package

Access ‘RRB ALP Fitter’ Mock Tests with

  • 60000+ Mocks and Previous Year Papers
  • Unlimited Re-Attempts
  • Personalised Report Card
  • 500% Refund on Final Selection
  • Largest Community
students-icon
354k+ students have already unlocked exclusive benefits with Test Prime!
Our Plans
Monthsup-arrow