
Data interpretation is a crucial aspect of competitive exams like the OSSC CGL (Odisha Staff Selection Commission Combined Graduate Level). To excel in this section, candidates need to have a strong grasp of mathematical concepts and the ability to interpret data accurately. Here, we present a curated list of 30 multiple-choice questions (MCQs) on data interpretation to help you sharpen your skills for the OSSC CGL exam.
Top 30 Data Interpretation MCQs for OSSC CGL
Q(1-5): Study the following table and answer the questions based on it. Expenditures of a Company (in Lakh Rupees) per Annum Over the given Years.
| Year | Item of Expenditure | ||||
| Salary | Fuel and Transport | Bonus | Interest on Loans | Taxes | |
| 1998 | 288 | 98 | 3.00 | 23.4 | 83 |
| 1999 | 342 | 112 | 2.52 | 32.5 | 108 |
| 2000 | 324 | 101 | 3.84 | 41.6 | 74 |
| 2001 | 336 | 133 | 3.68 | 36.4 | 88 |
| 2002 | 420 | 142 | 3.96 | 49.4 | 98 |
1. What is the average amount of interest per year which the company had to pay during this period?
A) Rs. 32.43 lakhs
B) Rs. 33.72 lakhs
C) Rs. 34.18 lakhs
D) Rs. 36.66 lakhs
Answer: D
Explanation: 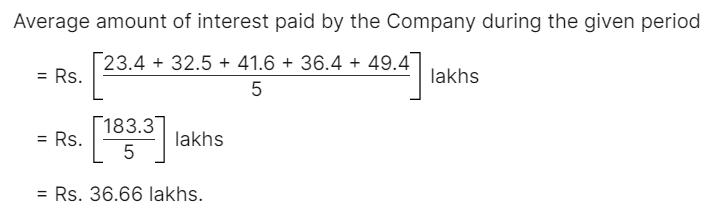
2. The total amount of bonus paid by the company during the given period is approximately what percent of the total amount of salary paid during this period?
A) 0.1%
B) 0.5%
C) 1%
D) 1.25%
Answer: C
Explanation: 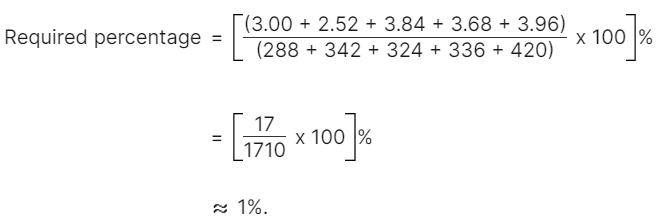
3. Total expenditure on all these items in 1998 was approximately what percent of the total expenditure in 2002?
A) 62%
B) 66%
C) 69%
D) 71%
Answer: C
Explanation: 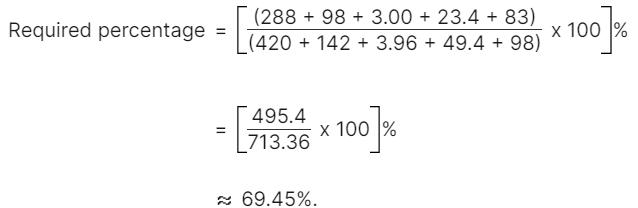
4. The total expenditure of the company over these items during the year 2000 is?
A) Rs. 544.44 lakhs
B) Rs. 501.11 lakhs
C) Rs. 446.46 lakhs
D) Rs. 478.87 lakhs
Answer: A
Explanation: 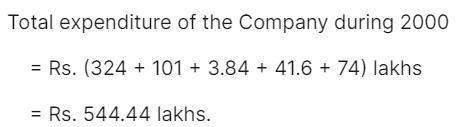
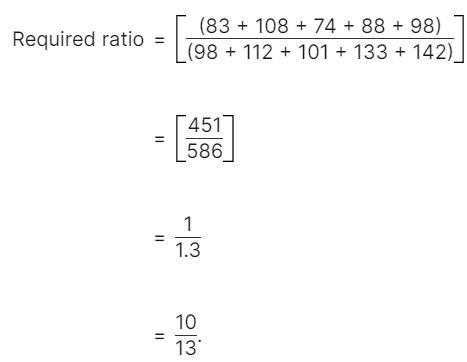
5. The ratio between the total expenditure on Taxes for all the years and the total expenditure on Fuel and Transport for all the years respectively is approximately?
A) 4:7
B) 10:13
C) 15:18
D) 5:8
Answer: B
Q(6-10): Number of Candidates Appeared and Qualified in a Competitive Examination from Different States Over the Years.
| State | Year | |||||||||
| 1997 | 1998 | 1999 | 2000 | 2001 | ||||||
| App. | Qual. | App. | Qual. | App. | Qual. | App. | Qual. | App. | Qual. | |
| M | 5200 | 720 | 8500 | 980 | 7400 | 850 | 6800 | 775 | 9500 | 1125 |
| N | 7500 | 840 | 9200 | 1050 | 8450 | 920 | 9200 | 980 | 8800 | 1020 |
| P | 6400 | 780 | 8800 | 1020 | 7800 | 890 | 8750 | 1010 | 9750 | 1250 |
| Q | 8100 | 950 | 9500 | 1240 | 8700 | 980 | 9700 | 1200 | 8950 | 995 |
| R | 7800 | 870 | 7600 | 940 | 9800 | 1350 | 7600 | 945 | 7990 | 885 |
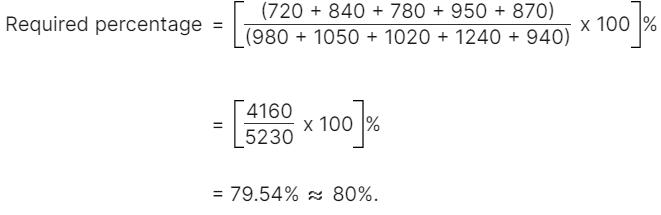
6. What is the approximate percentage of candidates qualified from all states together in 1997 compared to those qualified in 1998?
a) 72%
b) 77%
c) 80%
d) 83%
Answer: c) 80%
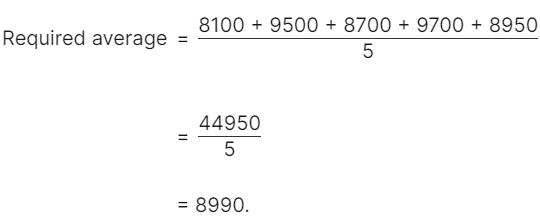
7. What is the average number of candidates who appeared from State Q during the given years?
a) 8700
b) 8760
c) 8990
d) 8920
Answer: c) 8990
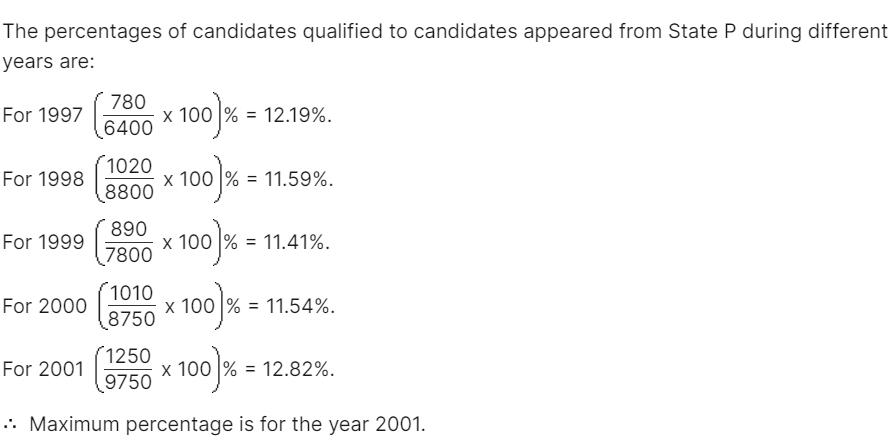
8. In which of the given years did the number of candidates appearing from State P have the maximum percentage of qualified candidates?
a) 1997
b) 1998
c) 1999
d) 2001
Answer: d) 2001
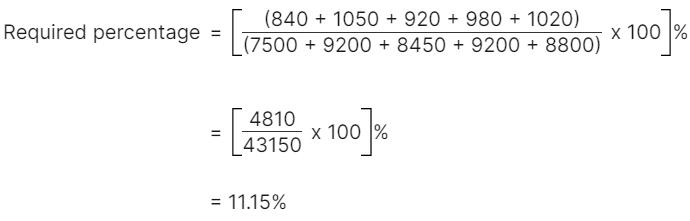
9. What is the percentage of candidates qualified from State N for all the years together, over the candidates appeared from State N during all the years together?
a) 12.36%
b) 12.16%
c) 11.47%
d) 11.15%
Answer: d) 11.15%
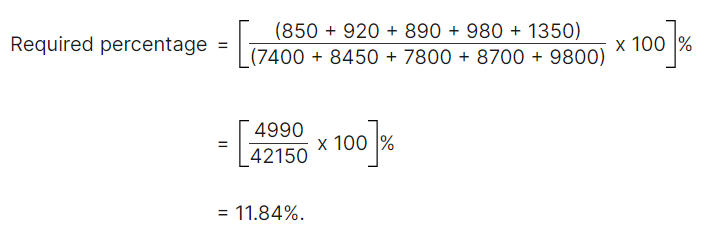
10. What is the percentage of the total number of qualified candidates to the total number of appeared candidates among all the five states in 1999?
a) 11.49%
b) 11.84%
c) 12.21%
d) 12.57%
Answer: b) 11.84%
Q(11-15): The bar graph given below shows the sales of books (in thousand number) from six branches of a publishing company during two consecutive years 2000 and 2001. Sales of Books (in thousand numbers) from Six Branches – B1, B2, B3, B4, B5 and B6 of a publishing Company in 2000 and 2001.
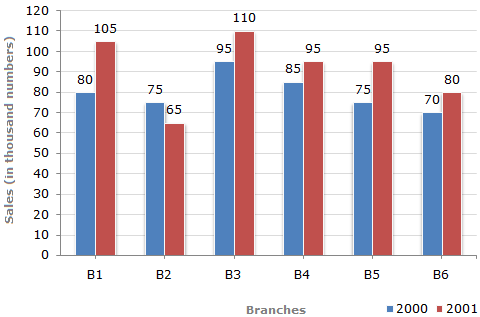
11. What is the ratio of the total sales of branch B2 for both years to the total sales of branch B4 for both years?
a) 2:3
b) 3:5
c) 4:5
d) 7:9
Answer: d
Explanation: Required ratio
= (75 + 65) / (85 + 95) = 140 / 180
= 7 / 9.
12. Total sales of branch B6 for both the years is what percent of the total sales of branches B3 for both the years?
a) 68.54%
b) 71.11%
c) 73.17%
d) 75.55%
Answer: c
Explanation: Required percentage = [(70 + 80) / (95 + 110)] * 100 = (150 / 205) * 100 = 73.17%.
13. What percent of the average sales of branches B1, B2, and B3 in 2001 is the average sales of branches B1, B3, and B6 in 2000?
a) 75%
b) 77.5%
c) 82.5%
d) 87.5%
Answer: d
Explanation: Required percentage = [(245/3) / (280/3)] * 100
= (245/280) * 100
= 87.5%.
14. What is the average sales of all the branches (in thousand numbers) for the year 2000?
a) 73
b) 80
c) 83
d) 88
Answer: b
Explanation: Average sales of all the six branches (in thousand numbers) for the year 2000
= [(80 + 75 + 95 + 85 + 75 + 70) / 6]
= 80.
15. Total sales of branches B1, B3, and B5 together for both the years (in thousand numbers) is?
a) 250
b) 310
c) 435
d) 560
Answer: d
Explanation: Total sales of branches B1, B3, and B5 for both the years (in thousand numbers)
= (80 + 105) + (95 + 110) + (75 + 95) = 560.
Q(16-20): The following bar chart shows the composition of the GDP two countries (India and Pakistan)
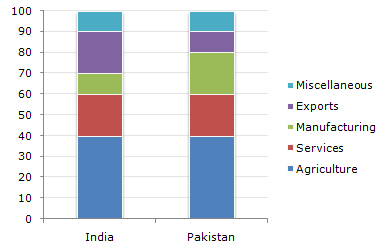
16. If the total GDP of Pakistan is Rs. 10,000 crore, then what is the GDP accounted for by Manufacturing?
A) Rs. 200 crore
B) Rs. 600 crore
C) Rs. 2,000 crore
D) Rs. 6,000 crore
Answer: Option C
Explanation: 20% of 10000 = 2000
17. What fraction of India’s GDP is accounted for by Services?
A) (6/33)th
B) (1/5)th
C)(2/3)rd
D) None of these
Answer: Option B
Explanation: Services account for 20%, i.e., (1/5)th of the GDP of India.
18. If the total GDP of India is Rs. 30,000 crores, then what is the GDP accounted for by Agriculture, Services, and Miscellaneous combined?
A) Rs. 18,500 crore
B) Rs. 18,000 crore
C) Rs. 21,000 crore
D) Rs. 15,000 crore
Answer: Option C
Explanation:
(40+20+10)% of 30,000 = Rs. 21,000 crore.
19. Which country accounts for a higher earning out of Services and Miscellaneous together?
A) India
B) Pakistan
C) Both spend equal amounts
D) Cannot be determined
Answer: Option D
Explanation: Although the percentage of Services and Miscellaneous combined is equal for both countries, we cannot compare without data on their respective GDPs.
20. If the total GDP is the same for both countries, then what percentage is Pakistan’s income through agriculture over India’s income through Services?
A) 100%
B) 200%
C) 133.33%
D) None of these
Answer: Option A
Explanation: Since the GDP is the same, the percentage difference can be calculated as
(40−20)/20
=100%.
Q(21-25): The following pie-chart shows the percentage distribution of the expenditure incurred in publishing a book. Study the pie-chart and the answer the questions based on it. Various Expenditures (in percentage) Incurred in Publishing a Book.
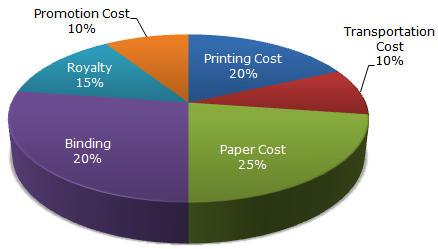
21. If the total GDP of Pakistan is Rs. 10,000 crore, then a GDP accounted for by Manufacturing is?
a) Rs. 200 crore
b) Rs. 600 crore
c) Rs. 800 crore
d) Rs. 400 crore
Answer: b) Rs. 600 crore
Explanation: Let the amount of Royalty to be paid for these books be Rs. r.
Then, 20 : 15 = 30600 : r => r = Rs. (30600 x 15/20)= Rs. 22,950.
22. What is the central angle of the sector corresponding to the expenditure incurred on Royalty?
a) 15°
b) 24°
c) 54°
d) 48°
Answer: c) 54°
Explanation:
Central angle corresponding to Royalty = (15% of 360)°
=(15/100)x 360)°
= 54°.
23. The price of the book is marked 20% above the C.P. If the marked price of the book is Rs. 180, then what is the cost of the paper used in a single copy of the book?
a) Rs. 36
b) Rs. 37.50
c) Rs. 42
d) Rs. 44.25
Answer: b) Rs. 37.50
Explanation: Clearly, marked price of the book = 120% of C.P.
Also, cost of paper = 25% of C.P
Let the cost of paper for a single book be Rs. n.

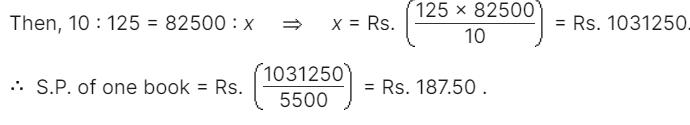
24. If 5500 copies are published and the transportation cost on them amounts to Rs. 82500, then what should be the selling price of the book so that the publisher can earn a profit of 25%?
a) Rs. 187.50
b) Rs. 191.50
c) Rs. 175
d) Rs. 180
Answer: a) Rs. 187.50
Explanation: For the publisher to earn a profit of 25%, S.P. = 125% of C.P.
Also Transportation Cost = 10% of C.P.
Let the S.P. of 5500 books be Rs. x.
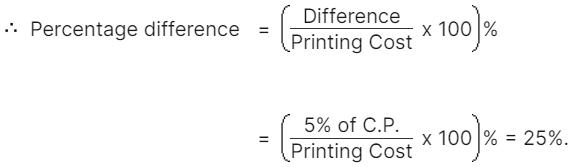
25. Royalty on the book is less than the printing cost by:
a) 5%
b) 33.33%
c) 20%
d) 25%
Answer: d) 25%
Explanation: Printing Cost of book = 20% of C.P.
Royalty on book = 15% of C.P.
Difference = (20% of C.P.) – (15% of C.P) = 5% of C.P
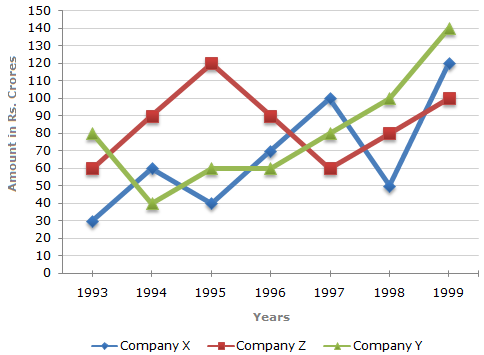
Q(25-30): Study the following line graph and answer the questions. Exports from Three Companies Over the Years (in Rs. crore)
26. For which of the following pairs of years the total exports from the three Companies together are equal?
A) 1995 and 1998
B) 1996 and 1998
C) 1997 and 1998
D) 1995 and 1996
Answer: Option D
Explanation: Total exports of the three Companies X, Y, and Z together during various years:
In 1993 = Rs. (30 + 80 + 60) crores = Rs. 170 crores.
In 1994 = Rs. (60 + 40 + 90) crores = Rs. 190 crores.
In 1995 = Rs. (40 + 60 + 120) crores = Rs. 220 crores.
In 1996 = Rs. (70 + 60 + 90) crores = Rs. 220 crores.
In 1997 = Rs. (100 + 80 + 60) crores = Rs. 240 crores.
In 1998 = Rs. (50 + 100 + 80) crores = Rs. 230 crores.
In 1999 = Rs. (120 + 140 + 100) crores = Rs. 360 crores.
Clearly, the total exports of the three Companies X, Y, and Z together are the same during the years 1995 and 1996.
27. Average annual exports during the given period for Company Y is approximately what percent of the average annual exports for Company Z?
A) 87.12%
B) 89.64%
C) 91.21%
D) 93.33%
Answer: Option D
Explanation: Average annual exports (in Rs. crore) of Company Y during the given period
= (1/7) * (80 + 40 + 60 + 60 + 80 + 100 + 140) = 80.
Average annual exports (in Rs. crore) of Company Z during the given period
= (1/7) * (60 + 90 + 120 + 90 + 60 + 80 + 100) = (600/7).
Therefore, Required percentage = [(80 * 100) / (600/7)] % ≈ 93.33%.
28. In which year was the difference between the exports from Companies X and Y the minimum?
A) 1994
B) 1995
C) 1996
D) 1997
Answer: Option C
Explanation: The difference between the exports from the Companies X and Y during the various years are:
In 1993 = Rs. (80 – 30) crores = Rs. 50 crores.
In 1994 = Rs. (60 – 40) crores = Rs. 20 crores.
In 1995 = Rs. (60 – 40) crores = Rs. 20 crores.
In 1996 = Rs. (70 – 60) crores = Rs. 10 crores.
In 1997 = Rs. (100 – 80) crores = Rs. 20 crores.
In 1998 = Rs. (100 – 50) crores = Rs. 50 crores.
In 1999 = Rs. (140 – 120) crores = Rs. 20 crores.
Clearly, the difference is minimum in the year 1996.
29. What was the difference between the average exports of the three Companies in 1993 and the average exports in 1998?
A) Rs. 15.33 crores
B) Rs. 18.67 crores
C) Rs. 20 crores
D) Rs. 22.17 crores
Answer: Option C
Explanation: Average exports of the three Companies X, Y, and Z in 1993
= Rs. [(1/3) * (30 + 80 + 60)] crores = Rs. (170/3) crores.
Average exports of the three Companies X, Y, and Z in 1998
= Rs. [(1/3) * (50 + 100 + 80)] crores = Rs. (230/3) crores.
Difference = Rs. [(230/3) – (170/3)] crores = Rs. (60/3) crores = Rs. 20 crores.
30. In how many of the given years, were the exports from Company Z more than the average annual exports over the given years?
A) 2
B) 3
C) 4
D) 5
Answer: Option C
Explanation: Average annual exports of Company Z during the given period
= (1/7) * (60 + 90 + 120 + 90 + 60 + 80 + 100)
= Rs. (600/7) crores
= Rs. 85.71 crores.
From the analysis of the graph, the exports of Company Z are more than the average annual exports of Company Z (i.e., Rs. 85.71 crores) during the years 1994, 1995, 1996, and 1999, i.e., during 4 of the given years.