Correct option is A
Concept:
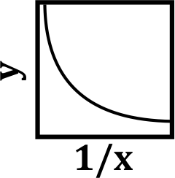
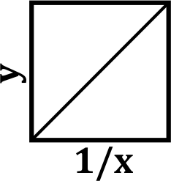
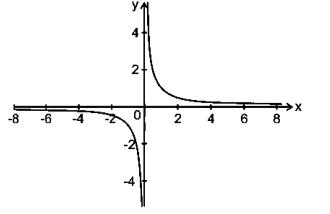
In the x-y axis, the graph of y = 1/x is
Solution:
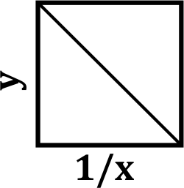
We have y = x
This can be written as
y = 1/(1/x)
Let, 1/x = X which is a new variable
⇒ y = 1/X
So, the required graph will be the same as y = 1/x
∴ The correct answer is option a.