arrow
arrow
arrow
This chart shows the investment in 3 sectors i.e. manufacturing, services and defence over a period of five different years. All values are in lakhs (
Question

This chart shows the investment in 3 sectors i.e. manufacturing, services and defence over a period of five different years. All values are in lakhs (rupees).

In which year was the investment in the Service sector closest to the average investment in this sector for the 5 year period?

A.

2008

B.

2007

C.

2006

D.

2004

Correct option is D

Formula Used:

Average =  Sum of yearly values5\frac{\text{Sum of yearly values}}{5}​​

Solution:

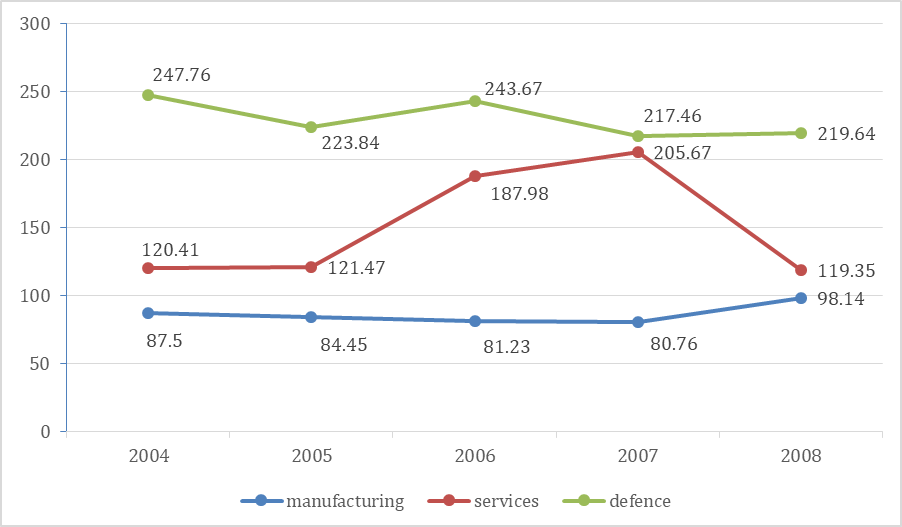
Service sector values from the chart:

2004: 120.41

2005: 121.47

2006: 187.98

2007: 205.67

2008: 119.35

Average = 120.41+121.47+187.98+205.67+119.355=754.885 \frac{120.41 + 121.47 + 187.98 + 205.67 + 119.35}{5} = \frac{754.88}{5}​ = 150.976

From the Option: Compare each year to average

Year

Investment

Difference from Avg.

2004

120.41

30.57

2006

187.98

37.00

2007

205.67

54.69

2008

119.35

31.63

Thus, the closest year is 2004

Free Tests

Free
Must Attempt

CBT-1 Full Mock Test 1

languageIcon English
  • pdpQsnIcon100 Questions
  • pdpsheetsIcon100 Marks
  • timerIcon90 Mins
languageIcon English
Free
Must Attempt

RRB NTPC Graduate Level PYP (Held on 5 Jun 2025 S1)

languageIcon English
  • pdpQsnIcon100 Questions
  • pdpsheetsIcon100 Marks
  • timerIcon90 Mins
languageIcon English
Free
Must Attempt

RRB NTPC UG Level PYP (Held on 7 Aug 2025 S1)

languageIcon English
  • pdpQsnIcon100 Questions
  • pdpsheetsIcon100 Marks
  • timerIcon90 Mins
languageIcon English

Similar Questions

test-prime-package

Access ‘RRB NTPC’ Mock Tests with

  • 60000+ Mocks and Previous Year Papers
  • Unlimited Re-Attempts
  • Personalised Report Card
  • 500% Refund on Final Selection
  • Largest Community
students-icon
368k+ students have already unlocked exclusive benefits with Test Prime!
Our Plans
Monthsup-arrow