Correct option is A
Solution:
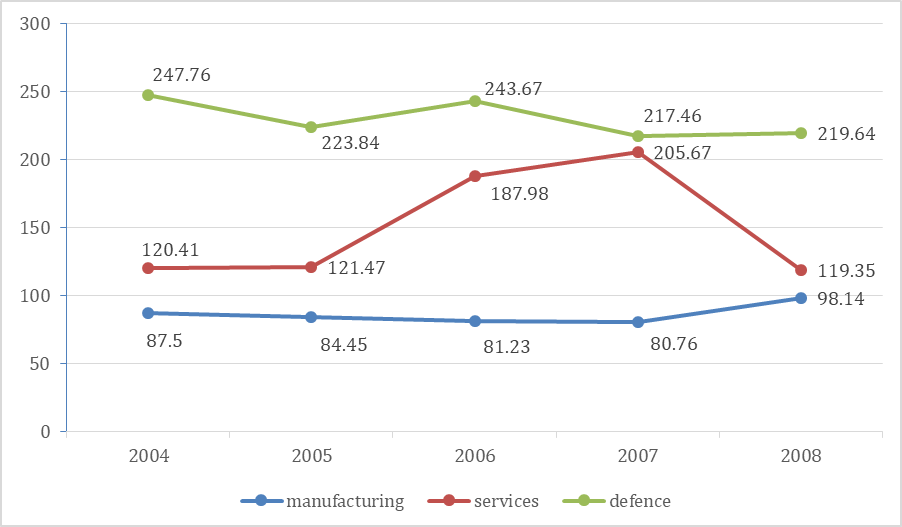
Year | Manufacturing | Services | Defence | Total Investment | Defence % Share |
2004 | 87.5 | 120.41 | 247.76 | 455.67 | 54.37% |
2005 | 84.45 | 121.47 | 223.84 | 429.76 | 52.08% |
2006 | 81.23 | 187.98 | 243.67 | 512.88 | 47.51% |
2007 | 80.76 | 205.67 | 217.46 | 503.89 | 43.15% |
2008 | 98.14 | 119.35 | 219.64 | 437.13 | 50.25% |
Thus, The lowest percentage share of defence sector investment is in 2007: 43.15%
 English
 100 Questions
 100 Marks
 90 Mins