Correct option is C
Given:
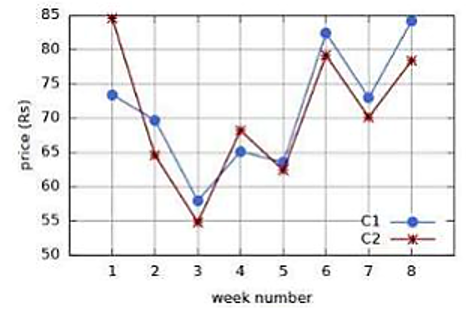
- Graphs showing the weekly price changes of two commodities, C1 and C2, over 8 weeks.
- Analyze the graphs to determine which statement is correct.
Solution:
Fluctuation:
- The fluctuation refers to how much the prices vary over the 8 weeks.
- From the graph, both commodities show fluctuations, but C2 has slightly smaller fluctuations than C1. Therefore, C1 does not have higher fluctuation than C2.
Average Price Comparison:
- The average price is calculated as the sum of prices over 8 weeks divided by 8.
- By visual inspection, the average price of C1 is not consistently lower than that of C2.
Largest Weekly Change:
- The largest weekly change is identified by observing the steepest slope in the graph.
- From the graph, the largest single-week change is for C2 (between week 4 and week 5).
Tendency for Reduction:
- C1 does not show a consistent tendency for reduction, as the prices increase and decrease variably over the 8 weeks.
Conclusion:
The correct statement is: (c) The largest change in a week is shown by C2.