Correct option is B
Explanation-
Understanding the Graph:
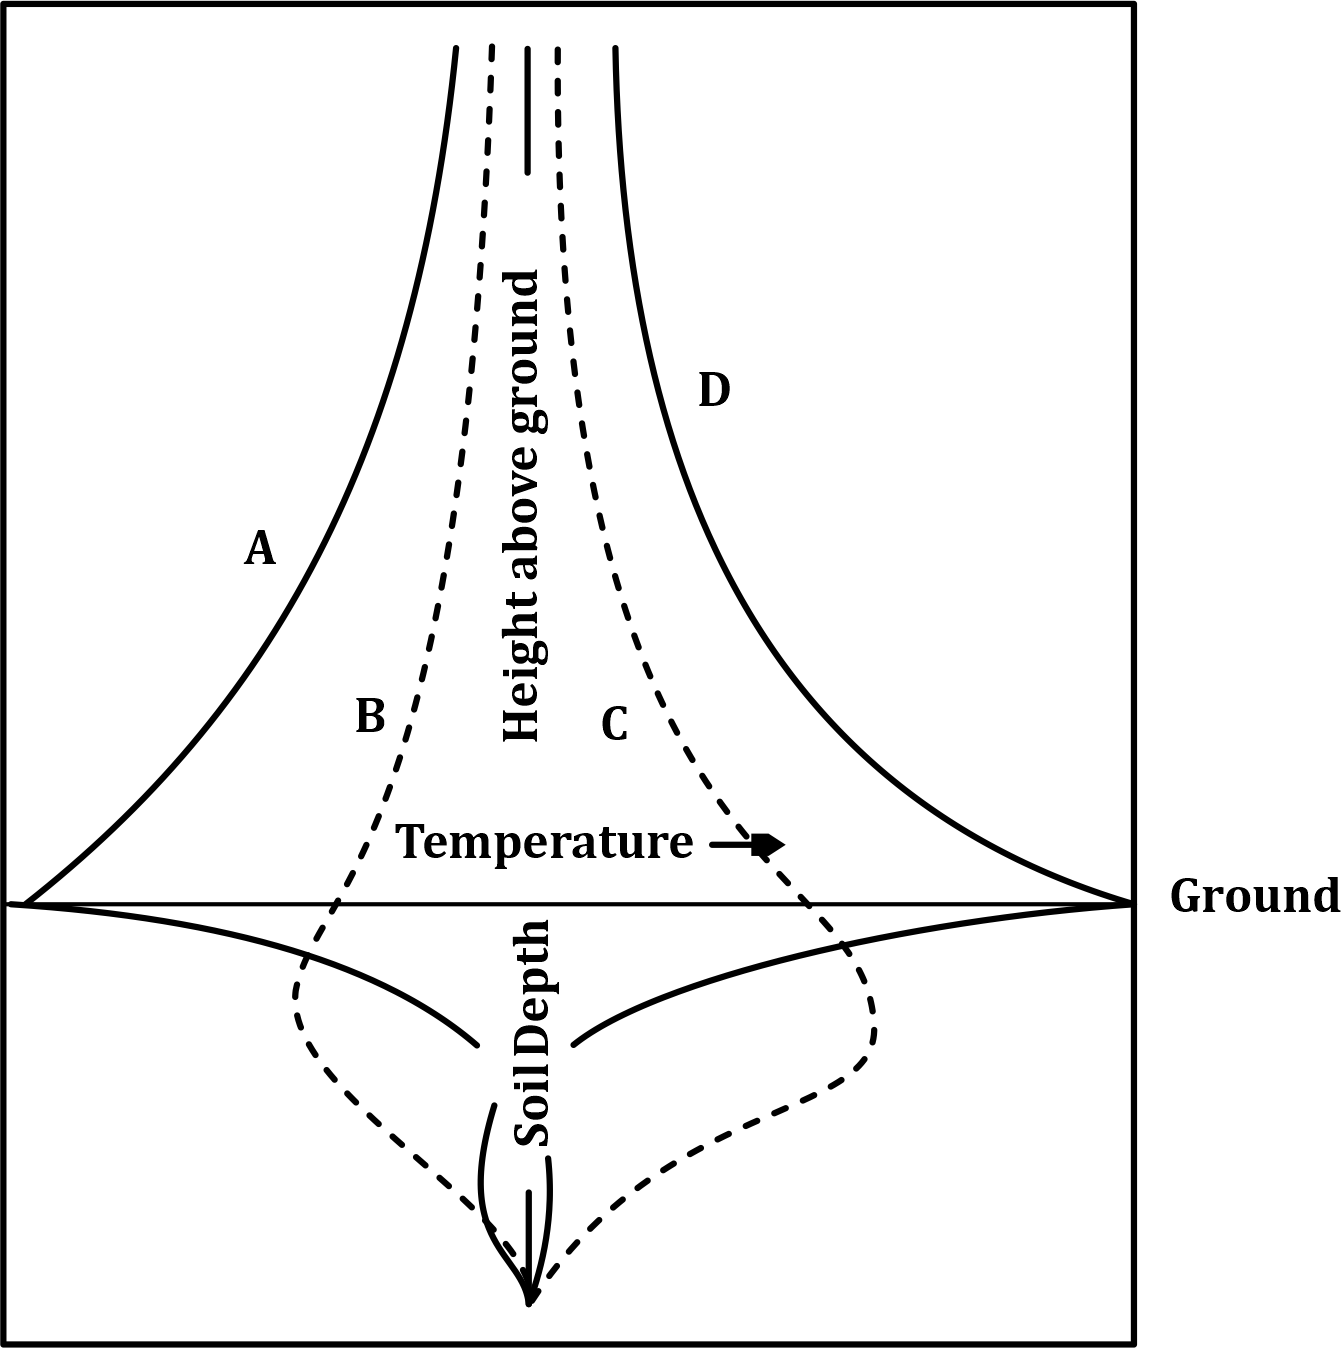
Each curve (A–D) shows temperature profiles at different times during a 24-hour diel cycle above and below ground.
Horizontal axis = Temperature
Vertical axis = Distance from the ground (above or below)
The shape of the curve tells us about the temperature gradient during a specific time of day.
Analyze each curve and time point:
A → iv. Midnight
Observation: Curve A shows the lowest temperatures above and below ground. The surface has cooled the most, and soil has lost much of its heat. This is consistent with midnight, when the earth radiates heat and no solar input exists.
B → i. Immediately after sunrise
Observation: A slight temperature increase near the ground surface, but upper layers are still cold. Heat has just started entering the atmosphere and ground surface. The temperature gradient is steep only near the ground.
C → iii. Immediately before sunset
Observation: Moderately high temperatures both above and below ground. But less than peak (noon) because the sun is setting and cooling has begun.
D → ii. Noon
Observation: This profile shows the maximum surface and near-surface temperatures. Heat penetrates above and below the ground. Represents strong solar radiation during midday.
Correct answer - a-iv, b-i, c-iii, d-ii (Option b)