arrow
arrow
arrow
​The graph below depicts trajectories (A and D) of some of the major drives of global environmental change (I to iv) that are mentioned alongside.​​Ma
Question

The graph below depicts trajectories (A and D) of some of the major drives of global environmental change (I to iv) that are mentioned alongside.

Match the trajectories with the correct drives:

A.

A-IV, B-III, C-II, D-I

B.

A-I, B-II, C-III, D-IV

C.

A-II, B-IV, C-I, D-III

D.

A-III, B-I, C-IV, D-I

Correct option is A

Explanation-

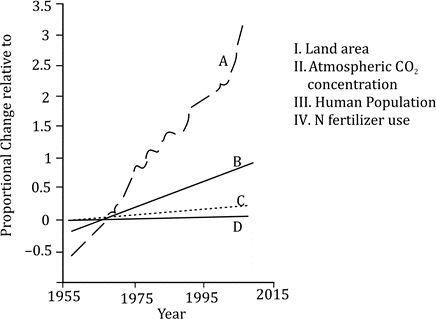
Trajectory A:  Steepest rise (≈3.5×) - (iv) N fertilizer use
Candidate causes: N fertilizer use (post-1950s Green Revolution)
 A = iv 
Trajectory B: Steady rise to ~2× -  (iii) Human population
Likely candidate: Human population
 B = iii 
Trajectory C: Gentle rise to ~1.2× - (ii) CO₂ concentration
Likely candidate: Atmospheric CO₂
 C = ii 
Trajectory D: Flat line (~0), little or no increase - (i) Land area
Most likely: Land area (remains mostly constant globally)
 D = i 

Option a : A–iv, B–iii, C–ii, D–i

Similar Questions

test-prime-package

Access ‘CSIR NET Life Sciences’ Mock Tests with

  • 60000+ Mocks and Previous Year Papers
  • Unlimited Re-Attempts
  • Personalised Report Card
  • 500% Refund on Final Selection
  • Largest Community
students-icon
353k+ students have already unlocked exclusive benefits with Test Prime!
Our Plans
Monthsup-arrow