arrow
arrow
arrow
​The given line graph shows the number of deaths in a city from the year 2017 to 2022. Study the graph and answer the questions that follows.What is t
Question

​The given line graph shows the number of deaths in a city from the year 2017 to 2022. Study the graph and answer the questions that follows.

What is the approximate percentage decrease in deaths from 2021 to 2022 and increase in deaths from 2020 to 2021 respectively?

A.

32.93% and 30%

B.

40% and 42.85%

C.

​42.83% and 40%

D.

​30% and 32.93%

Correct option is B

Given:

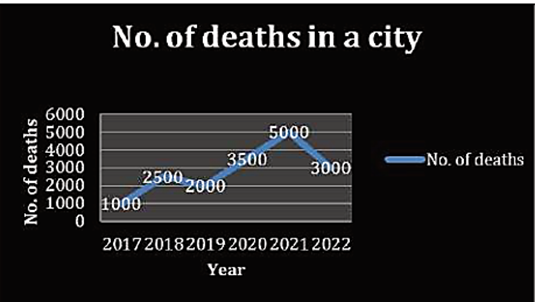
2021 to 2022 decrease in death 5000 to 3000

2020 to 2021 increase in death 3500 to 5000

Solution:

2021 to 2022 decrease death percentage = 5000- 3000 = 2000 

20005000×10%=40%\frac{2000}{5000}\times 10\% =40\%​​

2020 to 2021 increase death percentage = 3500 - 5000 = 1500

15003500×100%=300%7=42.85%\frac{1500}{3500}\times100\%= \frac{300\%}{7} = 42.85\%​  

Thus, Option(b) 40% and 42.85% is correct. 

Free Tests

Free
Must Attempt

CBT-1 Full Mock Test 1

languageIcon English
  • pdpQsnIcon100 Questions
  • pdpsheetsIcon100 Marks
  • timerIcon90 Mins
languageIcon English
Free
Must Attempt

RRB NTPC Graduate Level PYP (Held on 5 Jun 2025 S1)

languageIcon English
  • pdpQsnIcon100 Questions
  • pdpsheetsIcon100 Marks
  • timerIcon90 Mins
languageIcon English
Free
Must Attempt

CBT-1 General Awareness Section Test 1

languageIcon English
  • pdpQsnIcon40 Questions
  • pdpsheetsIcon30 Marks
  • timerIcon25 Mins
languageIcon English

Similar Questions

test-prime-package

Access ‘RRB Group D’ Mock Tests with

  • 60000+ Mocks and Previous Year Papers
  • Unlimited Re-Attempts
  • Personalised Report Card
  • 500% Refund on Final Selection
  • Largest Community
students-icon
354k+ students have already unlocked exclusive benefits with Test Prime!
Our Plans
Monthsup-arrow