The given graph shows the profit percentage (profit percentage is calculated on the expenditure of the same year) of companies X and Y from the year 1
Question
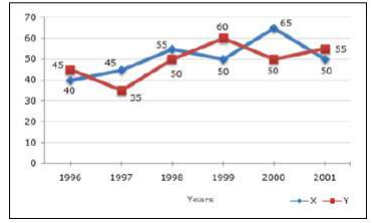
The given graph shows the profit percentage (profit percentage is calculated on the expenditure of the same year) of companies X and Y from the year 1996 to 2001. If the expenditure of company X in the year 1998 was Rs. 110 crore, what was its income in 1998?
A.
Rs.170.5 crore
B.
Rs.60.5 crore
C.
Rs.160 crore
D.
Rs.605 crore
Correct option is A
Rs.170.5 crore
Free Tests
Free
Must Attempt
Punjab Police Constable Paper-I & II PYP (Held on 30th July 2024 Shift 1)
English
150 Questions
150 Marks
180 Mins
English
Free
Must Attempt
Punjab Police Constable Paper-I & II PYP (Held on 6th Aug 2024 Shift 1)


 English
 150 Questions
 150 Marks
 180 Mins
