Correct option is B
Solution:
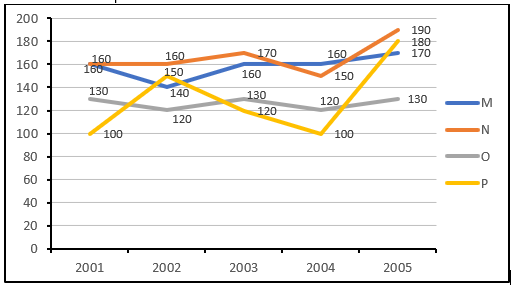
2001:
Total = 160 + 160 + 130 + 100 = 550
2002:
Total = 160 + 150 + 140 + 120 = 570
2003:
Total = 160 + 170 + 130 + 120 = 580
2004:
Total = 150 + 160 + 120 + 120 = 550
2005:
Total = 170 + 190 + 130 + 180 = 670
The year 2005 recorded the highest total rainfall across all cities, with a total rainfall of 670.
 English
 100 Questions
 100 Marks
 90 Mins