Correct option is A
Production of B in 2016 = 55
Production of B in 2012 = 30
Growth = (55 – 30)/30 x 100 = 83.33%


The given bar graph shows the data of the production of XYZ automobiles (in thousand numbers) by three branches, A, B and C of, a company over 5 years (2012-2016)).
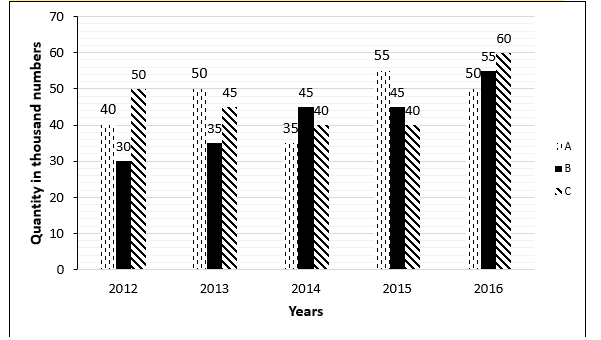
‘Which branch has recorded the highest percentage growth in production of XYZ automobiles in the given period?
Production of B in 2016 = 55
Production of B in 2012 = 30
Growth = (55 – 30)/30 x 100 = 83.33%
 English
 100 Questions
 100 Marks
 90 Mins English English100 Questions100 Marks90 Mins English English40 Questions30 Marks25 Mins English
If the price of rice increases by 20% and a person reduces its consumption by 20%, by what percentage will his total expenditure on rice decrease?
If 30% of a number exceeds 20% of it by 24, then the number is:
The count of a certain breed of bacteria was found to increase at the rate of 4% per hour and then decrease by 2% per hour. Find the bacteria at the end of 2 hours if the count was 2,00,000 initially.
Kiran spends 75% of his income. If he saves ₹90000, then his income (in ₹) is:
A bus is moving at a speed of 82 km/hr. If its speed is reduced by 28%, then what will be the new speed of the bus (in km/hr)?
A person spends 50% of his monthly salary on house rent. If he spends ₹912 on transport and ₹3,799 on groceries every month and saves the remaining ₹131, then find his monthly salary (in ₹).

Suggested Test Series

Suggested Test Series