Correct option is A
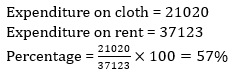
Solution:


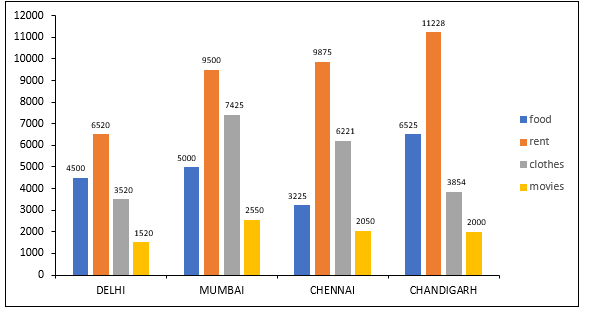
Solution:
 English
 100 Questions
 100 Marks
 90 Mins English English100 Questions100 Marks90 Mins English English100 Questions100 Marks90 Mins English
A fruit vendor disposed of 70% of his stock of apples. If, after this transaction, he is left with 720 apples, determine the initial quantity of apples he possessed.
A man's income increases by 21% and his expenditure increases by 9%. If his initial income was ₹45,000 and expenditure ₹27,000, find the percentage increase in savings.
Instead of increasing a number by 25%, a student decreased that number by 25% and then increased the obtained number by 25%. By what percentage is the answer less than the original number?
The price of fuel decreases by 40%, 60% and 60% in three successive months, but increases by 70% in the fourth month. What is the percentage increase or decrease in the price of fuel in the fourth month as compared to its original price?8597
The population increases by 13% annually. If the current population is 43,000, what will it be after 3 years? (in approx.)
The ratio of the income to the expenditure of a town is 7:6. If the income is ₹3500, what is the saving?
In an election between two candidates, one got 55% of the total valid votes. If 20% of the votes were invalid and the total number of votes was 9,000, what was the number of valid votes the other candidate got?
In an examination 60% students in Mathematics and 65% students in Science were passed. While 30% students in both the subjects were failed. If total 900 students appeared in the examination, then the total number of passed students is
If the price of an article is reduced by 25% and its daily sale is increased by 30%, then the net percent effect on daily sale is

Suggested Test Series

Suggested Test Series
A fruit vendor disposed of 70% of his stock of apples. If, after this transaction, he is left with 720 apples, determine the initial quantity of apples he possessed.
A man's income increases by 21% and his expenditure increases by 9%. If his initial income was ₹45,000 and expenditure ₹27,000, find the percentage increase in savings.
Instead of increasing a number by 25%, a student decreased that number by 25% and then increased the obtained number by 25%. By what percentage is the answer less than the original number?
The price of fuel decreases by 40%, 60% and 60% in three successive months, but increases by 70% in the fourth month. What is the percentage increase or decrease in the price of fuel in the fourth month as compared to its original price?8597
The population increases by 13% annually. If the current population is 43,000, what will it be after 3 years? (in approx.)
The ratio of the income to the expenditure of a town is 7:6. If the income is ₹3500, what is the saving?
In an election between two candidates, one got 55% of the total valid votes. If 20% of the votes were invalid and the total number of votes was 9,000, what was the number of valid votes the other candidate got?
In an examination 60% students in Mathematics and 65% students in Science were passed. While 30% students in both the subjects were failed. If total 900 students appeared in the examination, then the total number of passed students is
If the price of an article is reduced by 25% and its daily sale is increased by 30%, then the net percent effect on daily sale is