Correct option is D
Solution:
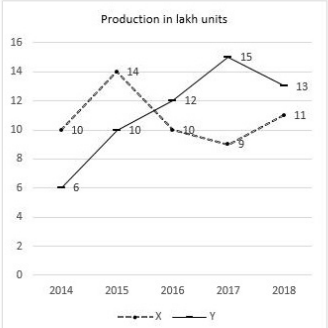
For company Y,
Production of engines in 2015 = 10,00,000
Production of engines in 2017 = 15,00,000
Production increase from 2015 to 2017 = 15,00,000 - 10,00,000
Production increase from 2015 to 2017 = 5,00,000
Percentage increase =
Percentage increase = 50%
Hence, option (d) is correct.
 English
 100 Questions
 100 Marks
 90 Mins