arrow
arrow
arrow
The following line graph shows the number of admissions of students (in thousands) in six different districts, A, B, C, D, E and F, in three consecuti
Question

The following line graph shows the number of admissions of students (in thousands) in six different districts, A, B, C, D, E and F, in three consecutive years, 2014, 2015 and 2016. Study the graph and answer the question.

What is the difference between the total number of admissions in district B for the given three years and the total number of admission in district E for the first two consecutive years (2015 and 2016)?

A.

20

B.

40

C.

80

D.

25

Correct option is A

Given:

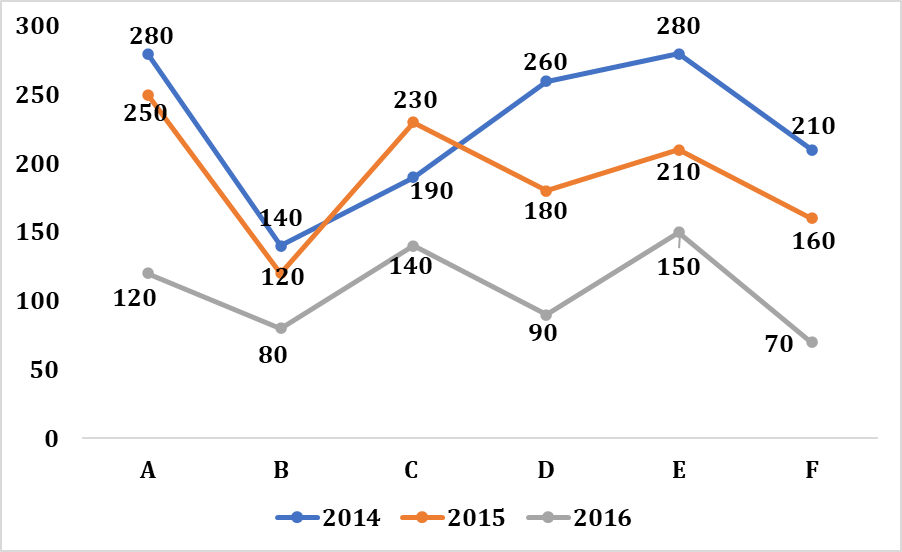
Admissions in district B: 2014: 80, 2015: 120, 2016: 140​

Admissions in district E: 2016: 150, 2015: 210

Formula Used:
Difference = Total admissions in B (2014 – 2016) - Total admissions in E (2015 – 2016).

Solution:
For B: 80+120+140=34080 + 120 + 140 = 340
For E:150+210=360150 + 210 = 360
Difference: 360 - 340 = 20

Free Tests

Free
Must Attempt

CBT-1 Full Mock Test 1

languageIcon English
  • pdpQsnIcon100 Questions
  • pdpsheetsIcon100 Marks
  • timerIcon90 Mins
languageIcon English
Free
Must Attempt

RRB NTPC Graduate Level PYP (Held on 5 Jun 2025 S1)

languageIcon English
  • pdpQsnIcon100 Questions
  • pdpsheetsIcon100 Marks
  • timerIcon90 Mins
languageIcon English
Free
Must Attempt

RRB NTPC UG Level PYP (Held on 7 Aug 2025 S1)

languageIcon English
  • pdpQsnIcon100 Questions
  • pdpsheetsIcon100 Marks
  • timerIcon90 Mins
languageIcon English

Similar Questions

test-prime-package

Access ‘RRB Group D’ Mock Tests with

  • 60000+ Mocks and Previous Year Papers
  • Unlimited Re-Attempts
  • Personalised Report Card
  • 500% Refund on Final Selection
  • Largest Community
students-icon
368k+ students have already unlocked exclusive benefits with Test Prime!
Our Plans
Monthsup-arrow