hamburger menu
All Coursesall course arrow
adda247
reward-icon
adda247
    arrow
    arrow
    arrow
    The following graph shows the sales made by two companies, A and B, over 7 years. Answer the question below based on the graph.In which year was the d
    Question

    The following graph shows the sales made by two companies, A and B, over 7 years. Answer the question below based on the graph.

    In which year was the difference between the sales made by A and that made by B the least?

    A.

    2006

    B.

    2003

    C.

    2002

    D.

    2005

    Correct option is A

    Given:

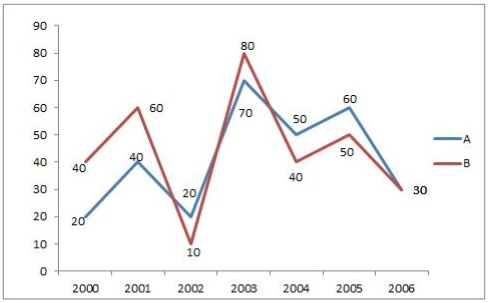
    Sales by Company A (2000–2006): 20, 40, 20, 70, 50, 60, 30.

    Sales by Company B (2000–2006): 40, 60, 10, 80, 40, 50, 30.

    Solution:
    Calculate the difference year-wise:

    2000: |20 - 40| = 20

    2001:|40 - 60| = 20

    2002:|20 - 10| = 10

    2003:|70 - 80| = 10

    2004:|50 - 40| = 10

    2005: |60 - 50| = 10

    2006: |30 - 30| = 0

    The least difference was in 2006 (0).

    Free Tests

    Free
    Must Attempt

    RRB NTPC UG Level PYP (Held on 7 Aug 2025 S1)

    languageIcon English
    • pdpQsnIcon100 Questions
    • pdpsheetsIcon100 Marks
    • timerIcon90 Mins
    languageIcon English
    Free
    Must Attempt

    CBT-1 Full Mock Test 1

    languageIcon English
    • pdpQsnIcon100 Questions
    • pdpsheetsIcon100 Marks
    • timerIcon90 Mins
    languageIcon English
    Free
    Must Attempt

    RRB Group D Full Mock Test 1

    languageIcon English
    • pdpQsnIcon100 Questions
    • pdpsheetsIcon100 Marks
    • timerIcon90 Mins
    languageIcon English

    Similar Questions

    test-prime-package

    Access ‘RRB NTPC’ Mock Tests with

    • 60000+ Mocks and Previous Year Papers
    • Unlimited Re-Attempts
    • Personalised Report Card
    • 500% Refund on Final Selection
    • Largest Community
    students-icon
    446k+ students have already unlocked exclusive benefits with Test Prime!

    Similar Questions

    Our Plans
    Monthsup-arrow