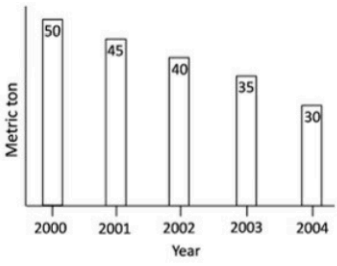
Correct option is A
Given:
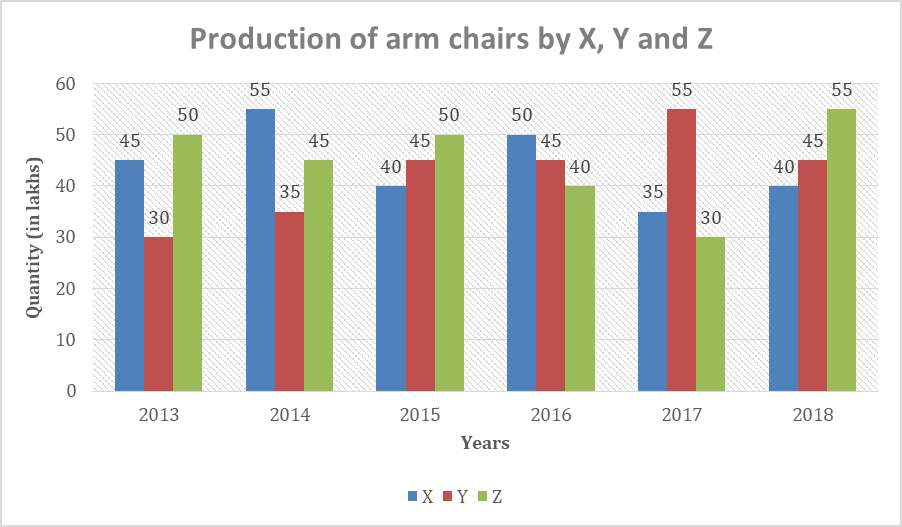
Company Z 2013 Production = 5000000
Company Z 2017 Production = 3000000
Solution:
Company Z 2013 Production = 5000000
Company Z 2017 Production = 3000000
decrease in the production = 5000000-3000000= 2000000
decrease in the production in percentage = 100%
= 100%,
= 40%
 English
 100 Questions
 100 Marks
 90 Mins