


Correct option is D
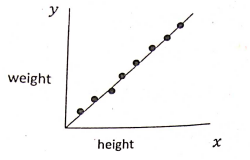
Ans. (d) Sol. The diagram shows a positive correlation between height and weight. This is typically seen when both variables increase together. A perfect positive correlation would show a straight line upward, indicating that as one variable increases, so does the other.
· (a) Weak negative correlation: This would show a downward slope, indicating that as one variable increases, the other decreases.
· (b) Strong positive correlation: This would also show an upward slope but would be steeper compared to moderate or weak correlations.
· (c) Perfect positive correlation: This would be a straight line going upward, indicating a direct linear relationship without deviation.
 English
 10 Questions
 10 Marks
 10 Mins
 Ans. (b) Code:

