Correct option is B
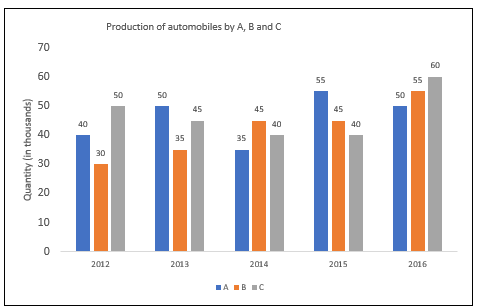
Production of automobiles by branch B from 2012 = 30
Production of automobiles by branch B from 2015= 45


Production of automobiles by branch B from 2012 = 30
Production of automobiles by branch B from 2015= 45
 English
 100 Questions
 100 Marks
 90 Mins English English100 Questions100 Marks90 Mins English English40 Questions30 Marks25 Mins English
 Year | Company P | Company Q |
2003 | 110 | 106 |
2004 | 130 | 140 |
2005 | 118 | 110 |
2006 | 200 | 190 |
2007 | 240 | 275 |
Pie-chart I shows the distribution of students who appeared in Board examination from schools A, B, C, D and E and pie-chart II shows the
distribution of students who passed the examination from these schools. Read both these pie-charts and answer the question :
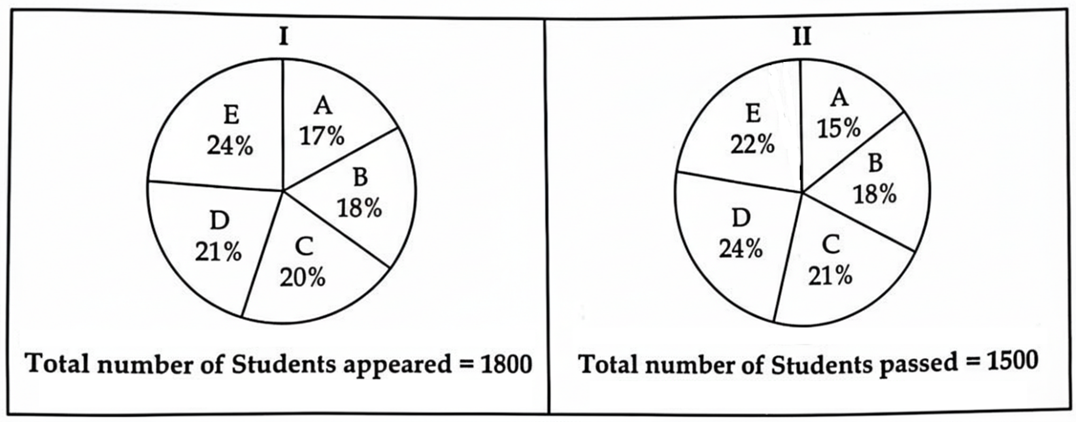
The total number of students who failed from schools B and D is what percent of the total number of students who passed from schools A and C?
Study the following histogram and answer the question :

(Note: The number of lamps is a multiple of 5)
The difference between the total number of neon lamps whose life time is 400 hours or more but less than 700 hours and the total number of neon lamps whose life time is 900 hours or more is t. The value of t lies between :
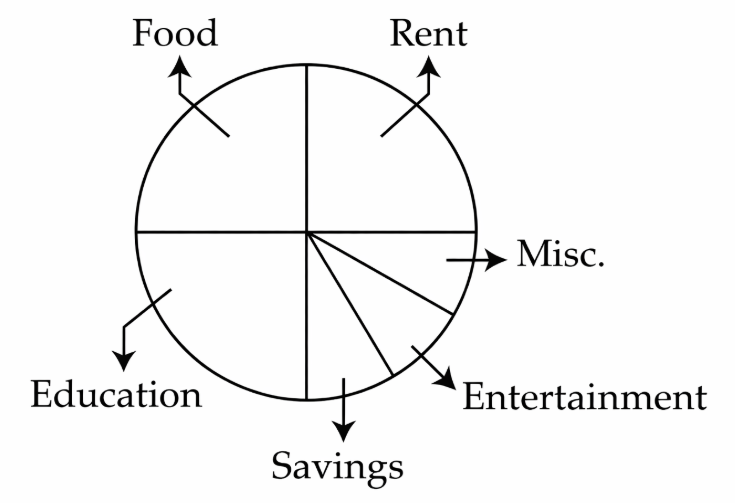
Study the following pie chart carefully and answer the question that follows :
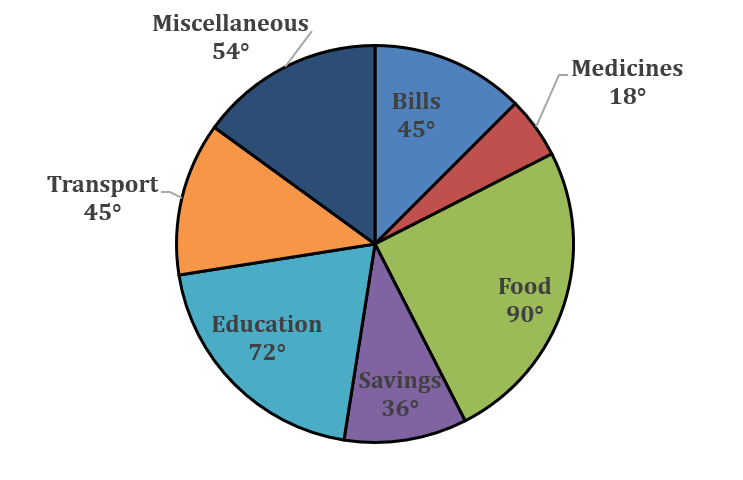
If the above pie chart shows the monthly expenditure of a family with monthly income ₹50,000, then find the ratio of the amount of 'Savings' to the amount spent on 'Food' :
Study the table and answer the given question.
Number of students admitted in 5 different schools during 5 given years :
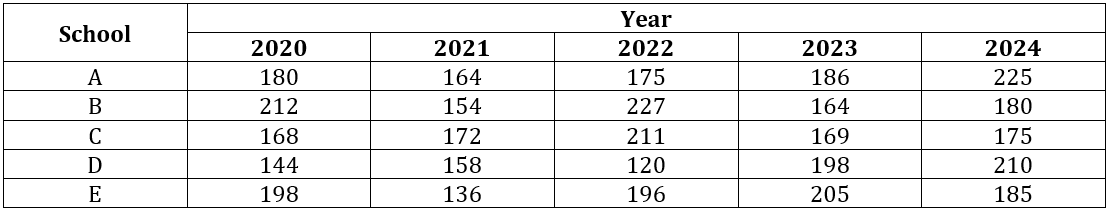
The average number of students admitted in schools B, C, D and E in 2021 is :
Read the following graph and answer the question :
Number of computers sold by dealers A, B, C and D in the years 2022 and 2023.
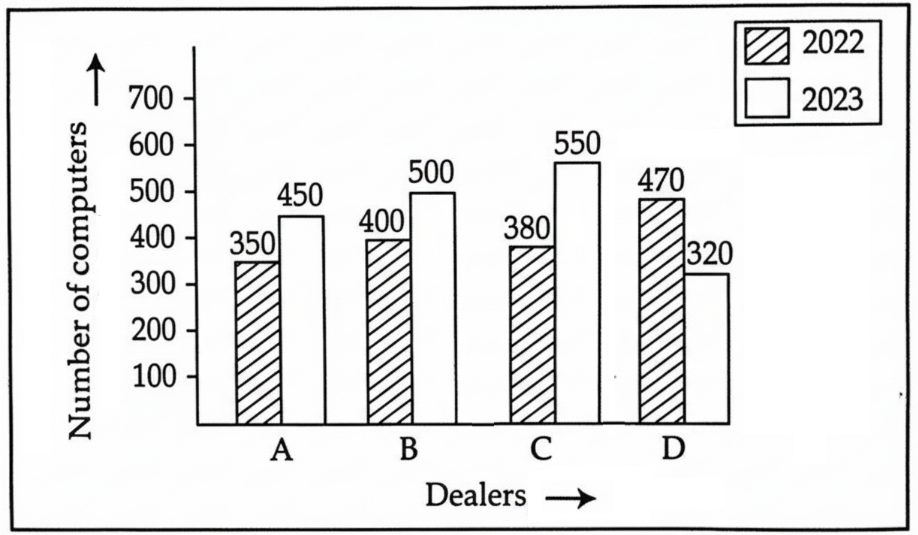
The average number of computers sold by dealers B and D in 2023 is what percent more than the average number of computers sold by dealers A, C and D in 2022 ?
Study the table and answer the given question.
Number of students admitted in 5 different schools during 5 given years :
If 40% of the total number of students admitted in schools A, B and C together in 2024 are boys, then the total number of girls admitted in schools A, B and C together in 2024 is :
Monthly budget of a family is shown in the pie chart. (The degree of Misc., Ent and Saving are same.)
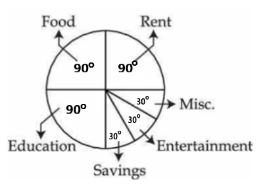
If savings of the family is ₹ 750, then monthly income is :
Monthly budget of a family is shown in the pie chart.
If savings of family is 750, then monthly income is :
Marks of two students, Simi and Shally in a unit test out of 50 are given. Based on this table, which of the following statements is wrong?
| Subject | Marks of Simi | Marks of Shally |
| English | 30 | 35 |
| Hindi | 45 | 42 |
| Mathematics | 48 | 50 |
| Science | 38 | 38 |
| Social Science | 25 | 40 |

Suggested Test Series

Suggested Test Series