Correct option is D
Given:
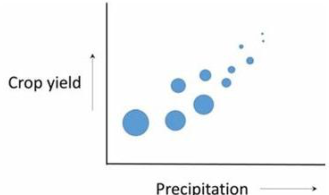
- The graph is a bubble plot showing:
- X-axis → Precipitation
- Y-axis → Crop yield
- Bubble size → Temperature (larger bubbles = higher temperature)
Visual Interpretation:
- As precipitation increases, crop yield increases → bubbles are positioned diagonally upward → Positive correlation
- Bubble sizes (temperature) decrease as we move right (higher precipitation) → temperature decreases → inverse relationship between precipitation and temperature
- Bubble sizes also decrease as crop yield increases → indicating an inverse relationship between temperature and crop yield
Evaluating the Options:
A. Crop yield is inversely related to temperature
True — as bubbles get smaller (temperature drops), crop yield increases
B. Precipitation and temperature are inversely related
True — as precipitation increases, bubble size (temperature) decreases
C. Crop yield and precipitation are positively related
True — graph clearly shows upward trend
D. Precipitation and temperature are positively related
False — The plot shows the opposite: as precipitation increases, temperature (bubble size) decreases
Final Answer: (D) Precipitation and temperature are positively related