arrow
arrow
arrow
​Study the given line graph and answer the following question.The given line graph depicts the number of pens and pencils sold by three shops (A, B an
Question

Study the given line graph and answer the following question.

The given line graph depicts the number of pens and pencils sold by three shops (A, B and C).

What is the difference between the total number of pens sold by shops A and B and the number of pencils sold by shop C?

A.

12

B.

14

C.

24

D.

22

Correct option is C

Given:

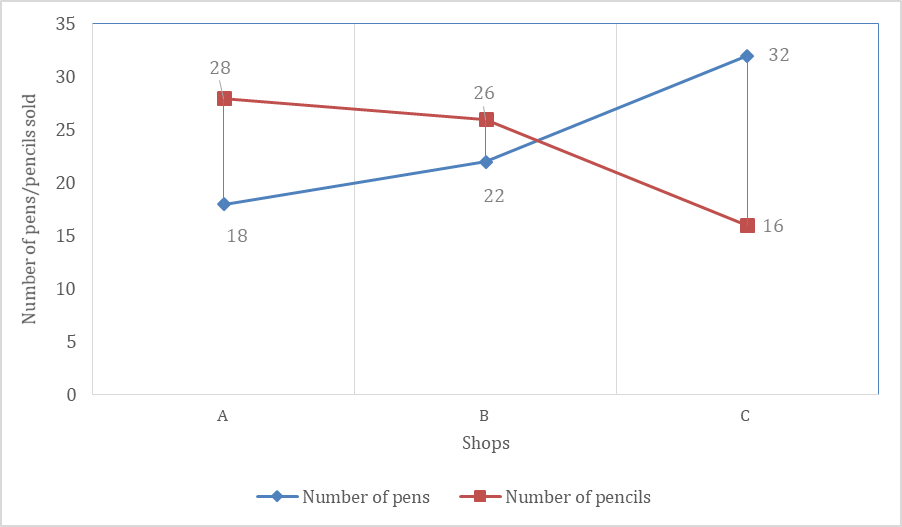
The number of pens and pencils sold by three shops (A, B and C).

Solution:

Number of pens sold by shop A = 18

Number of pens sold by shop B = 22

Number of pens sold by shop A and B = 18 +22 = 40

Number of pencil sold by shop C = 16

Difference = 40 -16 = 24

Free Tests

Free
Must Attempt

CBT-1 Full Mock Test 1

languageIcon English
  • pdpQsnIcon100 Questions
  • pdpsheetsIcon100 Marks
  • timerIcon90 Mins
languageIcon English
Free
Must Attempt

RRB NTPC Graduate Level PYP (Held on 5 Jun 2025 S1)

languageIcon English
  • pdpQsnIcon100 Questions
  • pdpsheetsIcon100 Marks
  • timerIcon90 Mins
languageIcon English
Free
Must Attempt

RRB NTPC UG Level PYP (Held on 7 Aug 2025 S1)

languageIcon English
  • pdpQsnIcon100 Questions
  • pdpsheetsIcon100 Marks
  • timerIcon90 Mins
languageIcon English

Similar Questions

test-prime-package

Access ‘RRB Group D’ Mock Tests with

  • 60000+ Mocks and Previous Year Papers
  • Unlimited Re-Attempts
  • Personalised Report Card
  • 500% Refund on Final Selection
  • Largest Community
students-icon
368k+ students have already unlocked exclusive benefits with Test Prime!
Our Plans
Monthsup-arrow