arrow
arrow
arrow
Study the following graph and answer the given questions.The given bar graph shows the annual production of rice in a state during the period 2018 to
Question

Study the following graph and answer the given questions.

The given bar graph shows the annual production of rice in a state during the period 2018 to 2022.

What is the total production of rice (in lakh tons) for the years 2020 , 2021 and 2022 together?

A.

270

B.

240

C.

250

D.

260

Correct option is B

Solution:
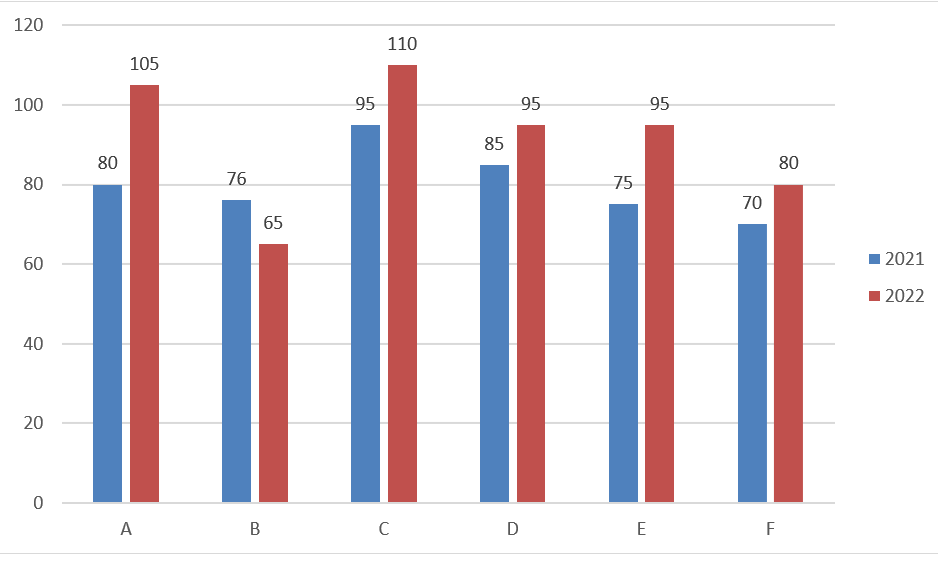
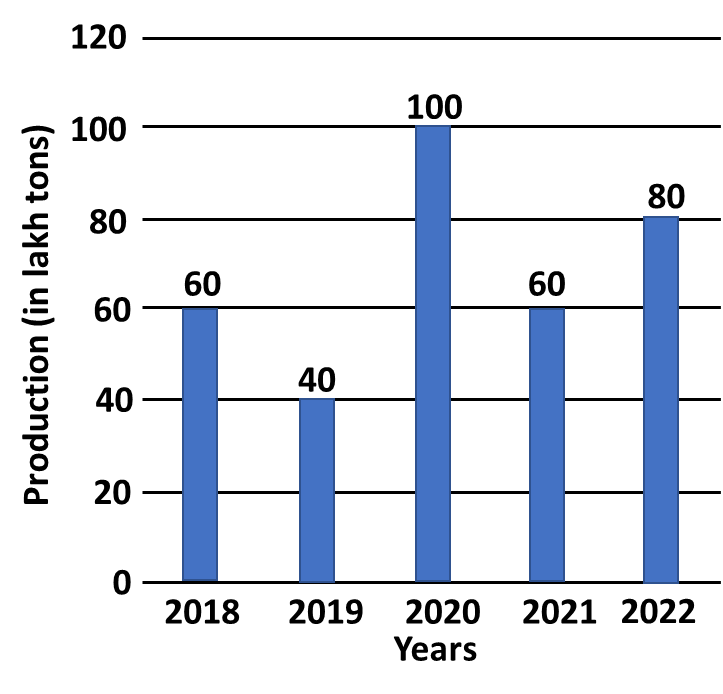
From the given Bar Graph we can get,
The production of rice for the years 2020 , 2021 and 2022 are 100, 60 and 80n respectively.
Total production of rice (in lakh tons) for the years 2020 , 2021 and 2022 together = 100+60+80 = 240 lakhs tons

Free Tests

Free
Must Attempt

CBT-1 Full Mock Test 1

languageIcon English
  • pdpQsnIcon100 Questions
  • pdpsheetsIcon100 Marks
  • timerIcon90 Mins
languageIcon English
Free
Must Attempt

RRB NTPC Graduate Level PYP (Held on 5 Jun 2025 S1)

languageIcon English
  • pdpQsnIcon100 Questions
  • pdpsheetsIcon100 Marks
  • timerIcon90 Mins
languageIcon English
Free
Must Attempt

CBT-1 General Awareness Section Test 1

languageIcon English
  • pdpQsnIcon40 Questions
  • pdpsheetsIcon30 Marks
  • timerIcon25 Mins
languageIcon English

Similar Questions

test-prime-package

Access ‘RRB ALP Stage-1 CBT’ Mock Tests with

  • 60000+ Mocks and Previous Year Papers
  • Unlimited Re-Attempts
  • Personalised Report Card
  • 500% Refund on Final Selection
  • Largest Community
students-icon
354k+ students have already unlocked exclusive benefits with Test Prime!
Our Plans
Monthsup-arrow