


Correct option is A
Explanation-
Gene duplication is an important process in evolution. It increases genetic material, and over time, duplicated genes can be lost (due to redundancy or mutations), acquire new functions (neofunctionalization), retain their original function, Or diverge in function. Over evolutionary time, the number of gene duplicates rises suddenly after duplication but then declines, and finally some are retained.
Graph 1 (Left Panel) – Single Gene Duplication Event
Axes:
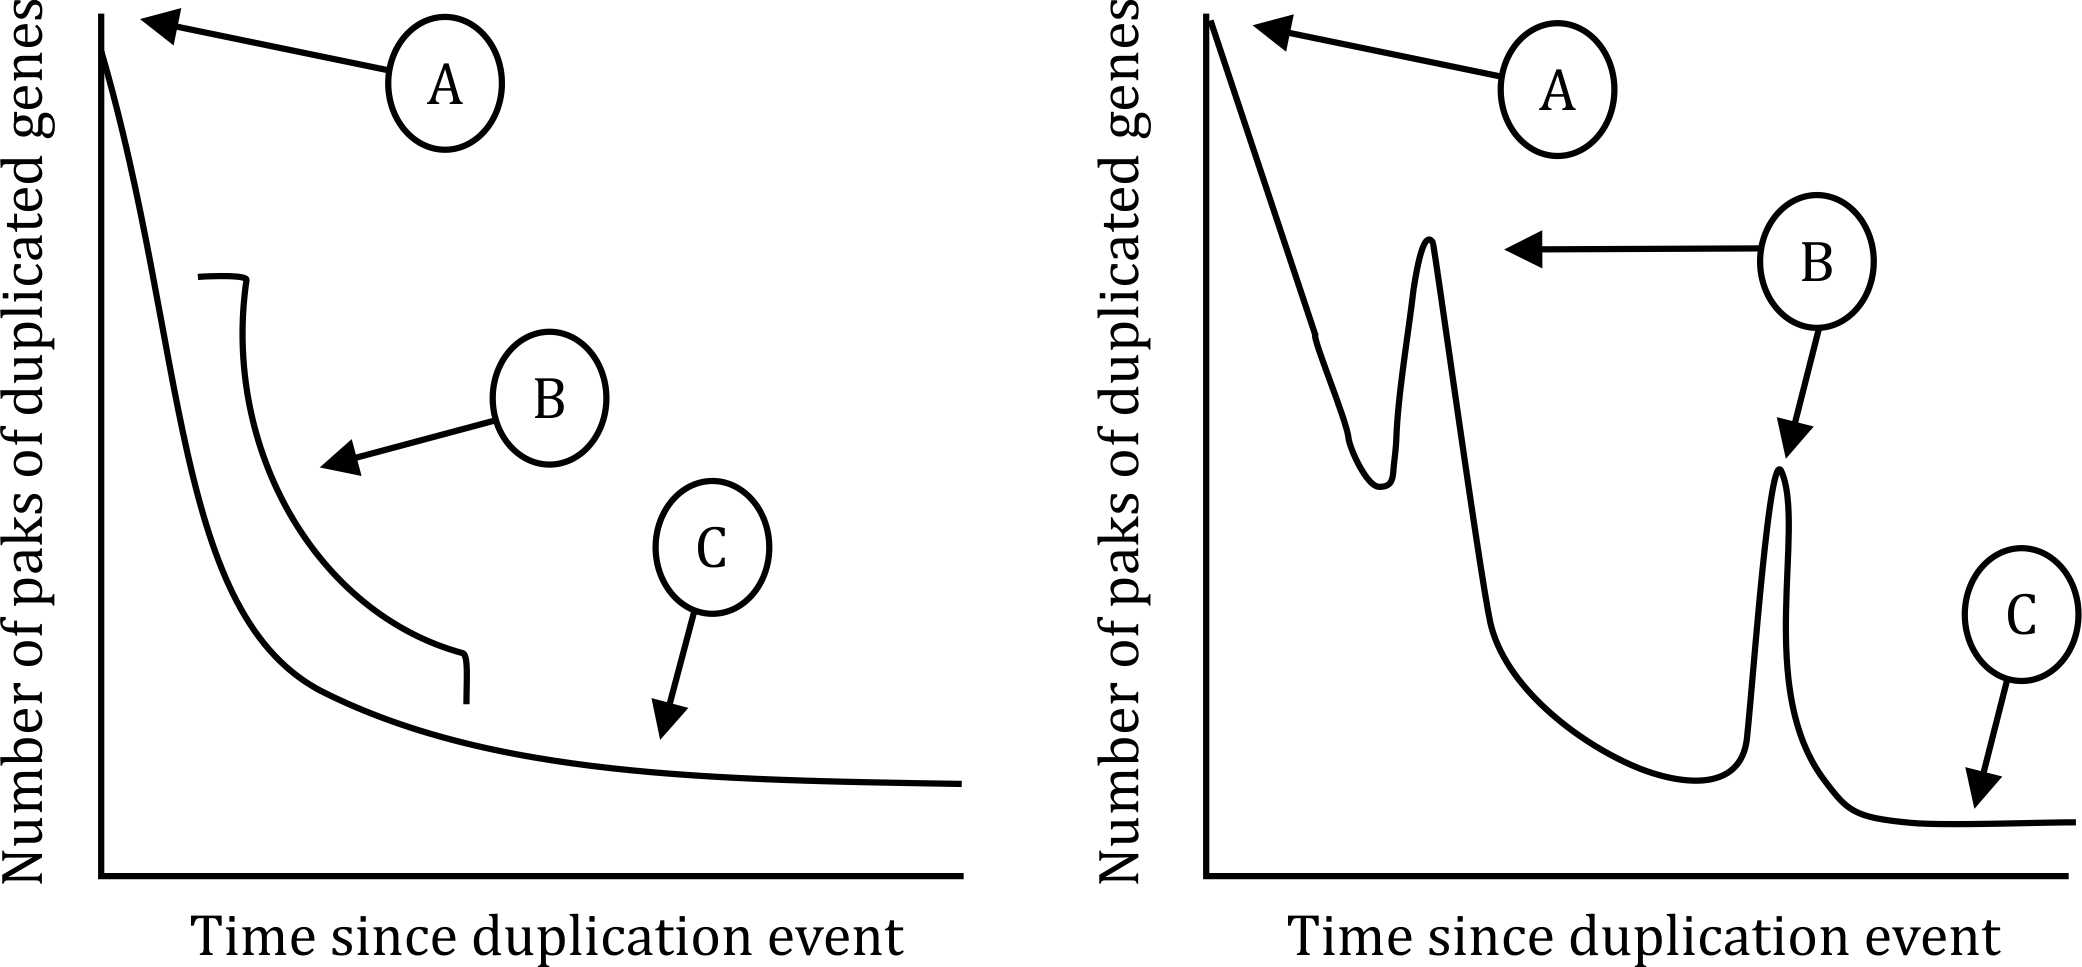
X-axis: Time since duplication event
Y-axis: Number/pairs of duplicated genes
Point A: Gene duplication event
At time = 0, there is a sudden spike in the number of duplicated genes. This marks the moment a whole genome duplication (WGD) or segmental duplication occurred.
Point B: Random loss of duplicated genes
After duplication, the number of duplicated genes drops steeply because not all duplicates are beneficial. Many are lost due to mutation accumulation, lack of selective pressure, dosage imbalance. This phase reflects natural selection or drift removing redundant genes.
Point C: Remaining pairs of duplicated genes
The curve flattens as time passes. These are the gene duplicates that are stably retained over evolutionary time. They might be functionally essential, neofunctionalized, subfunctionalized
Graph 2 (Right Panel) – Multiple Duplication Events
Point D: Additional gene duplication events
After the first dip (like graph 1), there’s a second spike. This indicates another round of gene duplication, maybe another WGD or segmental duplication. These additional events cause a temporary rise again.
A = Gene duplication event
B = Random loss of duplicated genes
C = Remaining pairs of duplicated genes
D = Additional gene duplication events
Correct answer: Option a
