arrow
arrow
arrow
Which one of the following graphs represents the cumulative area under the plot shown?
Question

Which one of the following graphs represents the cumulative area under the plot shown?

A.

B.

C.

D.

Correct option is A

Solution:

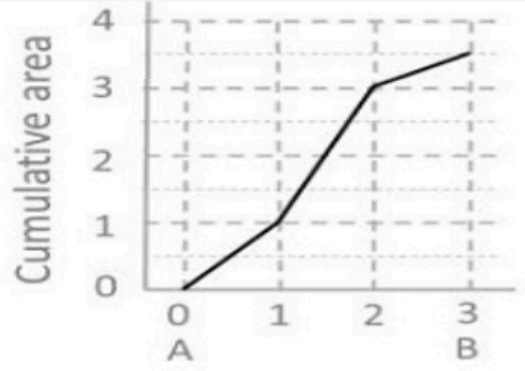
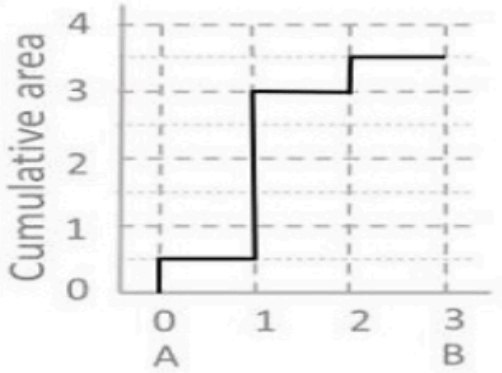
Option A(first graph) is correct.


Let's compare it properly:

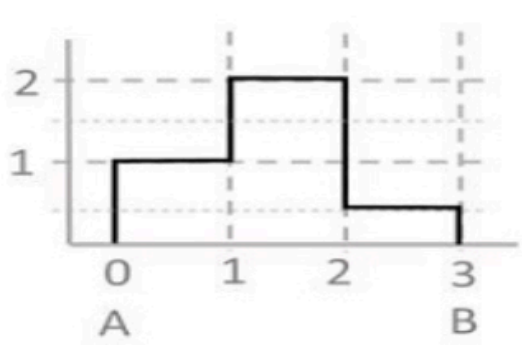
From the given block graph:

0 to 1 Height = 1 Area = 1

1 to 2 Height = 2 Area = 2

2 to 3 Height = 0.5 Area = 0.5

Thus cumulative area is:

At x = 0 0

At x = 1 1

At x = 2 3

At x = 3 3.5

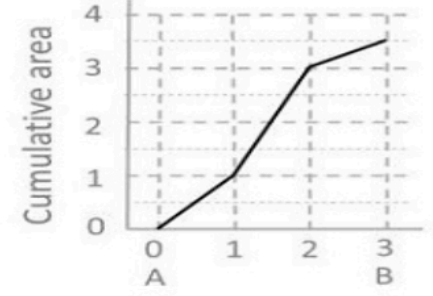
Now look at Option 1 (your selected option):

From 0 to 1 gradual linear rise (correct, because area is increasing uniformly when height is constant)

From 1 to 2 steeper rise (correct, because height is more = 2)

From 2 to 3 slower rise (correct, because height is only 0.5)

So Option A (Graph 1) is actually correct!

Final Final Answer:
Option A (first graph)

Similar Questions

test-prime-package

Access ‘CSIR NET- GENERAL APTITUDE’ Mock Tests with

  • 60000+ Mocks and Previous Year Papers
  • Unlimited Re-Attempts
  • Personalised Report Card
  • 500% Refund on Final Selection
  • Largest Community
students-icon
354k+ students have already unlocked exclusive benefits with Test Prime!
Our Plans
Monthsup-arrow