Correct option is D
Given,
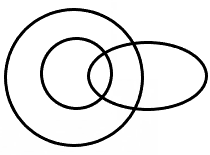
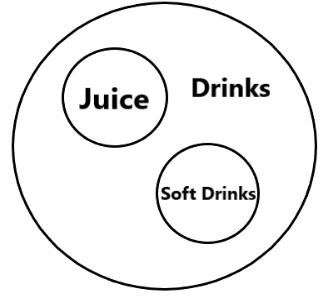
Juice, Soft Drinks, Drinks
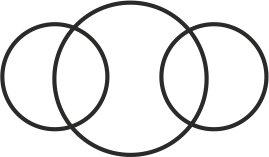
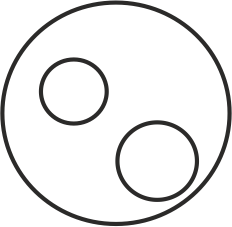
The correct Venn diagram should represent:
Juice and Soft Drinks are both types of Drinks.
This means that Juice and Soft Drinks are separate categories but are both part of the larger category Drinks.
The correct diagram should have two smaller circles (Juice and Soft Drinks) inside a larger circle (Drinks).
Thus, the correct option is: (d)
 English
 100 Questions
 100 Marks
 90 Mins