arrow
arrow
arrow
Which of the following equations represents the graph shown?
Question

Which of the following equations represents the graph shown?

A.

log y = (log x) - 1

B.

log y = (log x)/2 - 1

C.

log y = (log x) - log(1)

D.

log y = (log x)/2 + 1

Correct option is B

Given:
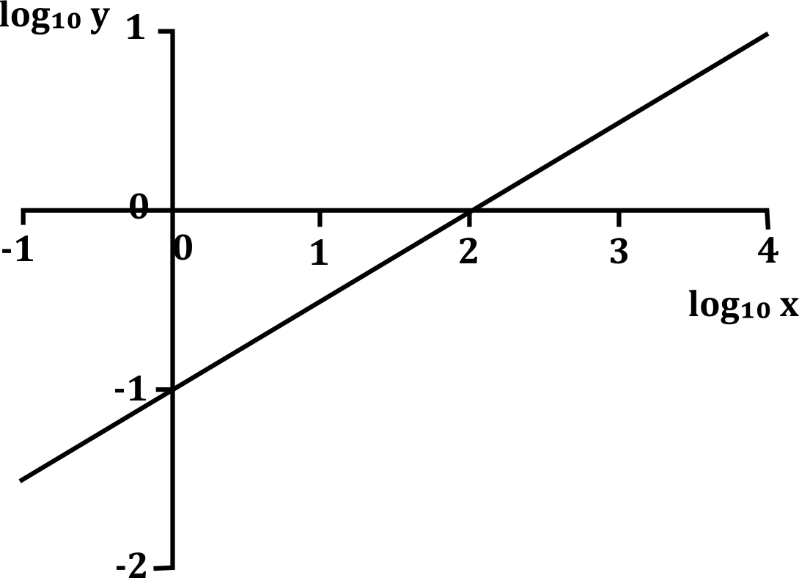
The graph is a straight line between log y (Y-axis) and log x (X-axis).
From the graph:
When log x = 0, log y = -1
When log x = 2, log y = 0
Using the line equation:
log y = m * log x + c

Calculate slope (m):

m=ΔY/ΔX=(0(1))/(20)=1/2m = ΔY / ΔX = (0 - (-1)) / (2 - 0) = 1 / 2

Now, use point (0, -1) to find c:

logy=(1/2)logx+c1 =(1/2)0+cc=1log y = (1/2) * log x + c-1 \\\ \\= (1/2)*0 + c → c = -1

logy=(1/2)logx1log y = (1/2) * log x - 1

Final Answer: (b) log y = (log x)/2 - 1
Important Key Points:
The graph shows a log-log straight line, representing a power function.
Slope is 1/2, derived from change in log y over change in log x.
Y-intercept is -1, confirming the constant in the equation.​

test-prime-package

Access ‘CSIR NET- GENERAL APTITUDE’ Mock Tests with

  • 60000+ Mocks and Previous Year Papers
  • Unlimited Re-Attempts
  • Personalised Report Card
  • 500% Refund on Final Selection
  • Largest Community
students-icon
354k+ students have already unlocked exclusive benefits with Test Prime!
Our Plans
Monthsup-arrow