arrow
arrow
arrow
To obtain the liquid limit of a soil, a graph is plotted between:
Question

To obtain the liquid limit of a soil, a graph is plotted between:

A.

dry density and water content

B.

void ratio of soil and number of blows.

C.

Volume of soil and water content

D.

water content and number of blows

Correct option is D


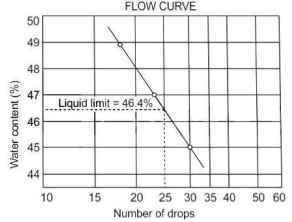
Flow curve:- The Flow curve is obtained from such a graph in which the number of blows is taken in
abscissa on a logarithmic scale and the corresponding water content is taken in the ordinate.
• Generally, it is a straight line and its slope is determined from the graph.
• The slope is known as the flow index.
• It is used to obtain the liquid limit of a soil.

test-prime-package

Access ‘SSC JE Civil’ Mock Tests with

  • 60000+ Mocks and Previous Year Papers
  • Unlimited Re-Attempts
  • Personalised Report Card
  • 500% Refund on Final Selection
  • Largest Community
students-icon
354k+ students have already unlocked exclusive benefits with Test Prime!
test-prime-package

Access ‘SSC JE Civil’ Mock Tests with

  • 60000+ Mocks and Previous Year Papers
  • Unlimited Re-Attempts
  • Personalised Report Card
  • 500% Refund on Final Selection
  • Largest Community
students-icon
354k+ students have already unlocked exclusive benefits with Test Prime!
Our Plans
Monthsup-arrow