Correct option is A
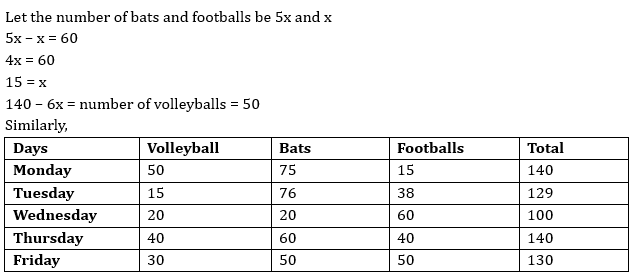
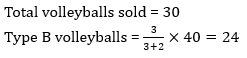


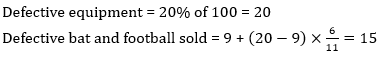
The table given below shows the total number of volleyballs, bat and footballs sold in five different days. It also shows the ratio of bats to football and difference between bat and football is given.
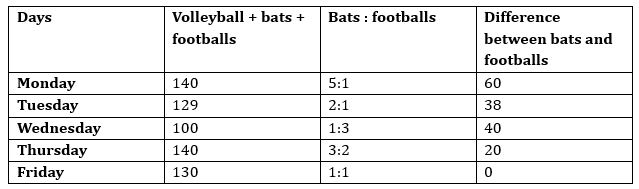
Note: Total volleyballs sold on Monday is equal to the total football sold on Friday.
Bats sold on Monday = 120% of 75 = 90
Football and volleyball sold is = 2×50=100
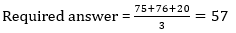
Required answer = 190

 English
 100 Questions
 100 Marks
 60 Mins English English35 Questions35 Marks20 Mins English English35 Questions35 Marks20 Mins English
The table given below shows the number of bottles of type B1, B2, B3, B4 and B5 manufactured by 2 companies P and Q.
B1 | B2 | B3 | B4 | B5 | |
P | 100 | 130 | 200 | 60 | 100 |
Q | 20 | 140 | 220 | 140 | 200 |
What is the ratio of the total number of bottles manufactured by P and the total number of bottles manufactured by Q respectively?
The table given below shows the number of pens in the 8 shops.
A | 100 |
B | 800 |
C | 200 |
D | 450 |
E | 500 |
F | 600 |
G | 750 |
H | 700 |
S1 = Total number of pens in B, C and D.
S2 = Total number of pens in F, G and H.
What is the value of S1: S2?
The table given below shows the marks of 3 students A, B and C in 3 subjects S1, S2 and S3
S1 | S2 | S3 | |
A | 50 | 90 | 80 |
B | 60 | 75 | 40 |
C | 80 | 30 | 70 |
Marks scored by A in S3 are how much more than the marks scored by B in S2?
The table given below shows the number of dogs in 8 towns.
A | 140 |
B | 100 |
C | 80 |
D | 120 |
E | 60 |
F | 110 |
G | 70 |
H | 110 |
In how many towns, number of dogs are more than 115?
Year | Company P | Company Q |
2003 | 110 | 106 |
2004 | 130 | 140 |
2005 | 118 | 110 |
2006 | 200 | 190 |
2007 | 240 | 275 |
Read the following graph and answer the question :
Number of computers sold by dealers A, B, C and D in the years 2022 and 2023.
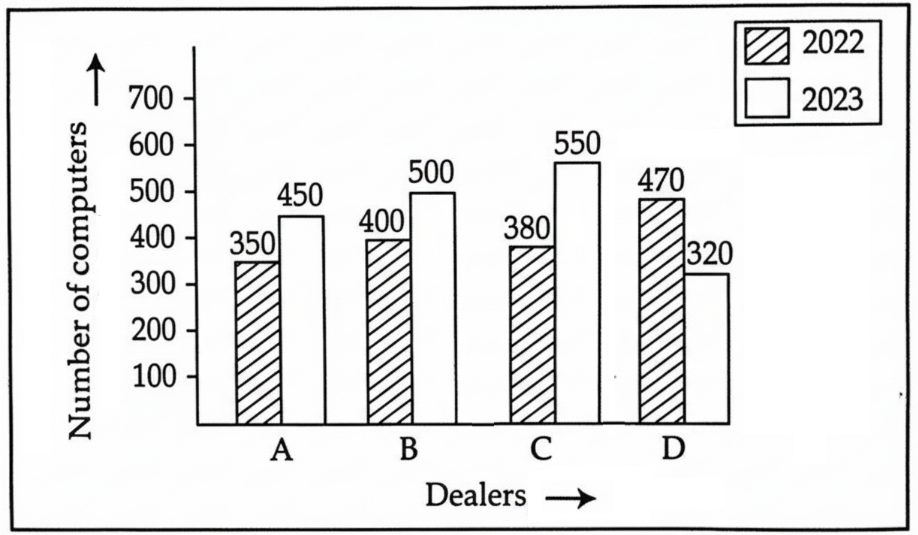
The average number of computers sold by dealers B and D in 2023 is what percent more than the average number of computers sold by dealers A, C and D in 2022 ?
Study the table and answer the given question.
Number of students admitted in 5 different schools during 5 given years :
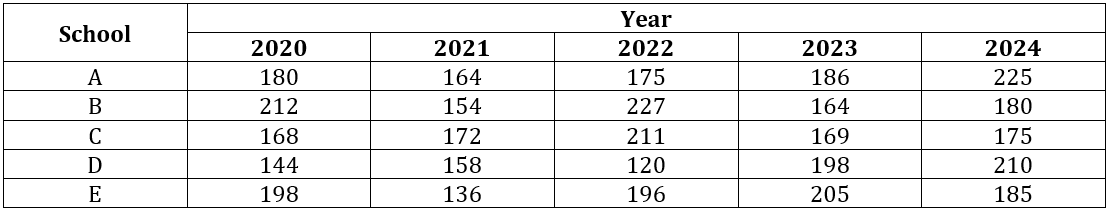
If 40% of the total number of students admitted in schools A, B and C together in 2024 are boys, then the total number of girls admitted in schools A, B and C together in 2024 is :
Study the table and answer the given question.
Number of students admitted in 5 different schools during 5 given years :
The average number of students admitted in schools B, C, D and E in 2021 is :
Marks of two students, Simi and Shally in a unit test out of 50 are given. Based on this table, which of the following statements is wrong?
| Subject | Marks of Simi | Marks of Shally |
| English | 30 | 35 |
| Hindi | 45 | 42 |
| Mathematics | 48 | 50 |
| Science | 38 | 38 |
| Social Science | 25 | 40 |
Refer the table to answer the question.
SALE OF CARS (IN LAKH) | YEAR 2009 | YEAR 2010 | YEAR 2011 |
MARUTI | 1.25 | 1.8 | 1.95 |
HONDA | 1.3 | 4.2 | 5.5 |
HYUNDAI | 1.55 | 1.35 | 2.3 |
Which of the company has highest average sales of car during the period 2009-11?

Suggested Test Series

Suggested Test Series
The table given below shows the number of bottles of type B1, B2, B3, B4 and B5 manufactured by 2 companies P and Q.
B1 | B2 | B3 | B4 | B5 | |
P | 100 | 130 | 200 | 60 | 100 |
Q | 20 | 140 | 220 | 140 | 200 |
What is the ratio of the total number of bottles manufactured by P and the total number of bottles manufactured by Q respectively?
The table given below shows the number of pens in the 8 shops.
A | 100 |
B | 800 |
C | 200 |
D | 450 |
E | 500 |
F | 600 |
G | 750 |
H | 700 |
S1 = Total number of pens in B, C and D.
S2 = Total number of pens in F, G and H.
What is the value of S1: S2?
The table given below shows the marks of 3 students A, B and C in 3 subjects S1, S2 and S3
S1 | S2 | S3 | |
A | 50 | 90 | 80 |
B | 60 | 75 | 40 |
C | 80 | 30 | 70 |
Marks scored by A in S3 are how much more than the marks scored by B in S2?
The table given below shows the number of dogs in 8 towns.
A | 140 |
B | 100 |
C | 80 |
D | 120 |
E | 60 |
F | 110 |
G | 70 |
H | 110 |
In how many towns, number of dogs are more than 115?
Year | Company P | Company Q |
2003 | 110 | 106 |
2004 | 130 | 140 |
2005 | 118 | 110 |
2006 | 200 | 190 |
2007 | 240 | 275 |
Read the following graph and answer the question :
Number of computers sold by dealers A, B, C and D in the years 2022 and 2023.
The average number of computers sold by dealers B and D in 2023 is what percent more than the average number of computers sold by dealers A, C and D in 2022 ?
Study the table and answer the given question.
Number of students admitted in 5 different schools during 5 given years :
If 40% of the total number of students admitted in schools A, B and C together in 2024 are boys, then the total number of girls admitted in schools A, B and C together in 2024 is :
Study the table and answer the given question.
Number of students admitted in 5 different schools during 5 given years :
The average number of students admitted in schools B, C, D and E in 2021 is :
Marks of two students, Simi and Shally in a unit test out of 50 are given. Based on this table, which of the following statements is wrong?
| Subject | Marks of Simi | Marks of Shally |
| English | 30 | 35 |
| Hindi | 45 | 42 |
| Mathematics | 48 | 50 |
| Science | 38 | 38 |
| Social Science | 25 | 40 |
Refer the table to answer the question.
SALE OF CARS (IN LAKH) | YEAR 2009 | YEAR 2010 | YEAR 2011 |
MARUTI | 1.25 | 1.8 | 1.95 |
HONDA | 1.3 | 4.2 | 5.5 |
HYUNDAI | 1.55 | 1.35 | 2.3 |
Which of the company has highest average sales of car during the period 2009-11?