hamburger menu
All Coursesall course arrow
adda247
reward-icon
adda247
    arrow
    arrow
    arrow
    The table given below gives data for wheat production (in lakh tonnes) for 5 states, from the year 2015 to 2019. Study the data given in the table and
    Question

    The table given below gives data for wheat production (in lakh tonnes) for 5 states, from the year 2015 to 2019. Study the data given in the table and answer the question below it.

    From 2015-2019, which state contributed the least to the total production of wheat?

    A.

    D

    B.

    C

    C.

    A

    D.

    B

    Correct option is A

    Solution:

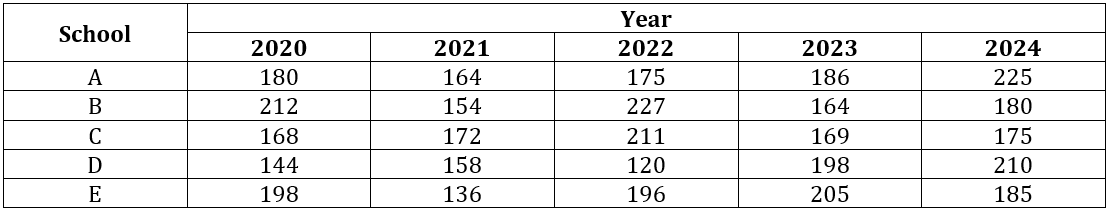
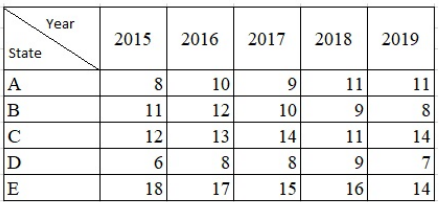
    Total product in state A = 8 + 10 + 9 + 11 + 11= 49

    Total production in state B = 11 + 12 + 10 + 9 + 8= 50

    Total production in state C = 12 + 13 + 14 + 11 + 14=60

    Total production in state D = 6 + 8 + 8 + 9 + 7=38

    Total production in state E = 18 + 17 + 15 + 16 + 14=80

    Production of wheat is least in state D.

    Free Tests

    Free
    Must Attempt

    CBT-1 Full Mock Test 1

    languageIcon English
    • pdpQsnIcon100 Questions
    • pdpsheetsIcon100 Marks
    • timerIcon90 Mins
    languageIcon English
    Free
    Must Attempt

    RRB NTPC UG Level PYP (Held on 7 Aug 2025 S1)

    languageIcon English
    • pdpQsnIcon100 Questions
    • pdpsheetsIcon100 Marks
    • timerIcon90 Mins
    languageIcon English
    Free
    Must Attempt

    CBT-1 General Awareness Section Test 1

    languageIcon English
    • pdpQsnIcon40 Questions
    • pdpsheetsIcon30 Marks
    • timerIcon25 Mins
    languageIcon English

    Similar Questions

    test-prime-package

    Access ‘RRB NTPC’ Mock Tests with

    • 60000+ Mocks and Previous Year Papers
    • Unlimited Re-Attempts
    • Personalised Report Card
    • 500% Refund on Final Selection
    • Largest Community
    students-icon
    382k+ students have already unlocked exclusive benefits with Test Prime!
    Our Plans
    Monthsup-arrow