All Courses
Telugu Offline
AP and TS Mega Pack
Telugu Railway
AP PSC
EMRS Telugu
TSPSC
Telugu Bank
AP Police
Telugu SSC
Intelligence Bureau Telugu
RRB ALP
Telangana High Court
AP TET
AP HIGH COURT
AP TS DSC
Telugu RRB JE
Tech Skills
Telugu Free Products
Telangana GPO
Home
No tag
No tag
The line graph given below shows the sales of a company from the year 2018 to 2022. Read the graph and answer the given question. Fi
Question
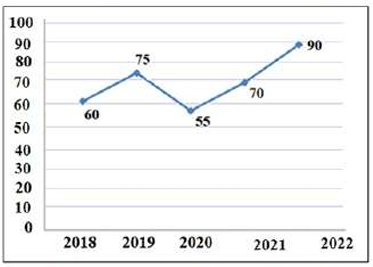
The line graph given below shows the sales of a company from the year 2018 to 2022. Read the graph and answer the given question.
Find the percentage decrease in sales from the year 2019 to 2020.
A.
16 2/3%
B.
26 1/3%
C.
26 2/3%
D.
16 1/3%
Solution
Correct option is C
26 2/3%
Free Tests
Free
Must Attempt
Punjab Police Constable Paper-I & II PYP (Held on 30th July 2024 Shift 1)
English
150 Questions
150 Marks
180 Mins
Attempt now
English
Free
Must Attempt
Punjab Police Constable Paper-I & II PYP (Held on 6th Aug 2024 Shift 1)
English
150 Questions
150 Marks
180 Mins
Attempt now
English
Free
Must Attempt
PSSSB Excise Inspector (Paper I) Mock Test -01
English
50 Questions
50 Marks
30 Mins
Attempt now
English
View More
Similar Questions
1)
State whether the following given statements are true or false.
(I) Computers are machines that can be programmed to follow instructions.
(II) Computers have the power to store information or data temporarily.
(III) Today all computers have the same processing power.
2)
Which of the given options best describes the truth of the following statements with reference to MS- Word 365
(I) Orientation option is used to switch pages between portrait and landscape layout
(II) Calibri, Arial and Times New Roman are known as font faces.
(III) MS-Word 365 clipboard allows us to copy up to 24 items
3)
Devices
Details
4)
ਇੰਤਕਾਮ ਸ਼ਬਦ ਦਾ ਅੰਗਰੇਜ਼ੀ ਅਨੁਵਾਦ ਹੈ
5)
Post-office saving bank is a useful scheme for salaried persons.
ਉਪਰੋਕਤ ਵਾਕ ਦਾ ਪੰਜਾਬੀ ਅਨੁਵਾਦ ਹੈ
6)
Nepotism ਸ਼ਬਦ ਦਾ ਪੰਜਾਬੀ ਅਨੁਵਾਦ ਹੈ
7)
In the question given below, three statements are given, followed by three conclusions I, II and III. You have to accept the given statements as true even if they seem to be at odds with the commonly known facts. Read all the conclusions and decide which of them logically follows from the given statements, ignoring commonly known facts.
Statement
Some shapes are circles.
Some shapes are spheres.
No sphere is a triangle
I) Some shapes are not triangles
II) Some circles are not triangles
III) Some circles are spheres
8)
Read the given statements and conclusions carefully. Assuming that the information given in the statements is true, even if it seems to be at odds with commonly known facts, decide which of the given conclusions logically follow from the statements
Statement
All girls are birds.
Some birds are students.
Some students are girls.
Conclusion
I. All girls are students.
II. All birds are girls.
III. Some girls are students.
9)
To complete the following alphabetic sequence, the question mark (?) should be replaced by
CYP EWR GUT ISV ?
10)
Seven persons P, Q,R, S,T, U and are sitting in a straight row facing north. Only three persons sit between Q and T. Only one person sits to the left of Q. S sits fourth to the left of V. R sits second to the left of T. U sits exactly between R and T
Who sits third to the right of Q
View More
Access ‘Punjab Police’ Mock Tests with
60000+ Mocks and Previous Year Papers
Unlimited Re-Attempts
Personalised Report Card
500% Refund on Final Selection
Largest Community
BUY NOW
383k+ students have already unlocked exclusive benefits with Test Prime!
Suggested Test Series
Punjab Police Constable 2026 Mock Test
Punjab Police Constable 2026 Mock Test
214 Tests
+ 2 Free Tests
PSSSB Excise Inspector Mock Test 2026
PSSSB Excise Inspector Mock Test 2026
360 Tests
+ 1 Free Tests
PSSSB Group D 2026 Mock Test
PSSSB Group D 2026 Mock Test
103 Tests
+ 1 Free Tests
PSSSB Clerk Mock Test 2026
PSSSB Clerk Mock Test 2026
189 Tests
+ 1 Free Tests
Punjab & Sind Local Bank Officer 2026 Mock Test Series
Punjab & Sind Local Bank Officer 2026 Mock Test Series
95 Tests
+ 1 Free Tests
View More
Our Plans
Months
BUY NOW
Chat With Us


 English
 150 Questions
 150 Marks
 180 Mins English English150 Questions150 Marks180 Mins English English50 Questions50 Marks30 Mins English
