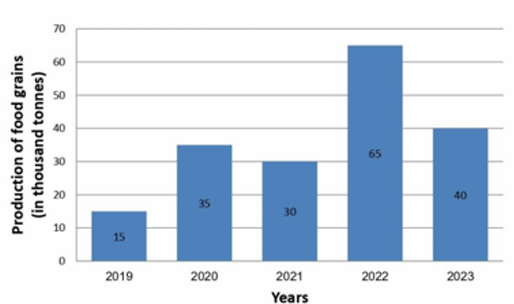
The graph shows the production of food grains of a country in different years. Study the graph and answer the question.
Reference: Foodgra
Question
The graph shows the production of food grains of a country in different years. Study the graph and answer the question.
Reference: Foodgrain Production (in thousand tonnes), Year (Years)
What was the percentage increase in production from 2021 to 2022 (to the nearest 2 decimal places)?
A.
116.67%
B.
105.23%
C.
112.23%
D.
119.68%
Correct option is A
116.67%
Free Tests
Free
Must Attempt
ST-01: Network Theory - I
English
15 Questions
15 Marks
15 Mins
English
Free
Must Attempt
ST-01 Reasoning
English
15 Questions
15 Marks
12 Mins
English
Free
Must Attempt
Punjab Police Constable Paper-I & II PYP (Held on 30th July 2024 Shift 1)


 English
 15 Questions
 15 Marks
 15 Mins
