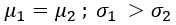
Correct option is D
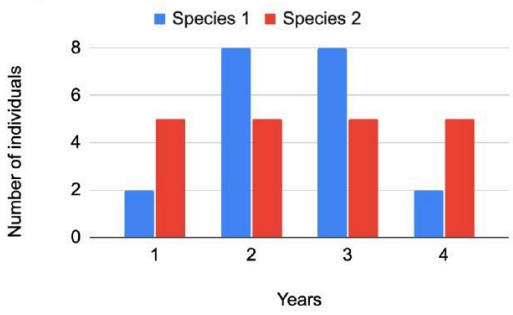
Observations from the Graph:
Step 1: Mean (μ\muμ)
Species 1:
Using the same values as before:
- Lifespan (xxx) = 1,2,3,41, 2, 3, 41,2,3,4
- Frequencies (fff) = 2,8,8,22, 8, 8, 22,8,8,2
Mean (μ1\mu_1μ1):
The mean is calculated using the formula:
μ=∑f∑(x⋅f)
For Species 1:
μ1=2+8+8+2(1⋅2)+(2⋅8)+(3⋅8)+(4⋅2) μ1=2050=2.5
Species 2:
Updated frequencies for f=5,5,5,5f = 5, 5, 5, 5f = 5,5,5,5:
μ2=5+5+5+5(1⋅5)+(2⋅5)+(3⋅5)+(4⋅5) μ2=2050=2.5
Thus, the mean lifespan for both species is the same:
μ1=μ2=2.5
Step 2: Standard Deviation (σ\sigmaσ)
The standard deviation formula is:
σ=∑f∑f⋅(x−μ)2
For Species 1:
σ1=20(2⋅(1−2.5)2)+(8⋅(2−2.5)2)+(8⋅(3−2.5)2)+(2⋅(4−2.5)2) σ1=2013=0.65≈0.81
For Species 2:
σ2=20(5⋅(1−2.5)2)+(5⋅(2−2.5)2)+(5⋅(3−2.5)2)+(5⋅(4−2.5)2) σ2=2025=1.25≈1.12
Thus, the standard deviation for Species 2 is greater than for Species 1:
σ1<σ2
Final Answer:
The correct option is (d): μ1=μ2;σ1<σ2