Correct option is B
Analysis:
Step 1: Understanding the Graph
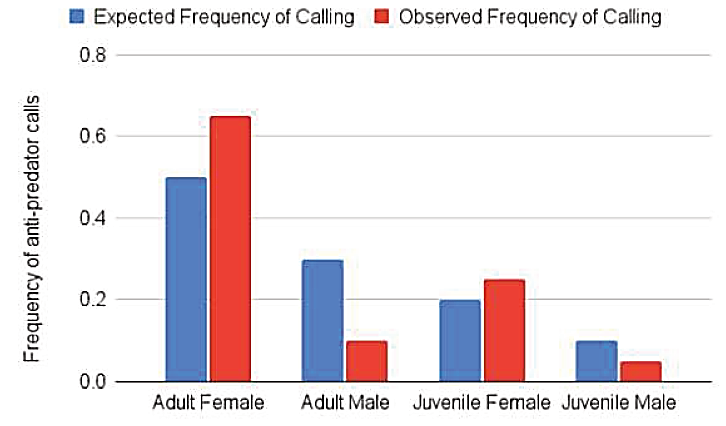
The graph presents the expected vs. observed frequency of anti-predator calls among different groups of squirrels:
Adult Female
Adult Male
Juvenile Female
Juvenile Male
Blue bars represent the expected frequency of calling.
Red bars represent the observed frequency of calling.
Step 2: Observing Trends in the Graph
Adult Females: The observed frequency (red bar) is higher than the expected frequency (blue bar), indicating they call more than expected.
Adult Males: The observed frequency is much lower than expected.
Juvenile Females: The observed frequency is slightly higher than expected.
Juvenile Males: The observed frequency is lower than expected but not zero.
Step 3: Evaluating the Answer Choices
(a) Adult males are less likely to see a predator than adult females.
The graph does not provide direct evidence of predator visibility for different groups, only their calling behavior.
Incorrect
(b) Adult females make higher than expected anti-predator calls.
The red bar (observed frequency) for adult females is significantly higher than the blue bar (expected frequency).
Correct Answer
(c) There are more adult females than adult males.
The graph does not show population numbers, only calling behavior.
Incorrect
(d) Juvenile males do not make anti-predator calls.
The observed frequency for juvenile males is low, but not zero, meaning they do call, just less frequently than expected.
Incorrect
Final Answer:
(b) Adult females make higher than expected anti-predator calls.