Correct option is C
Solution:
Average sale January to July =
= = 328.57
Then the average sale January to July is nearest sale of February(300).


The graph below represents number of bikes sold over a period of seven months. Observe the graph and answer the question that follows:
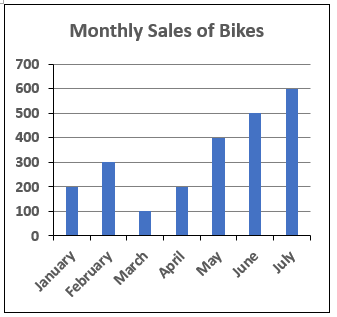
In which of the following months, was the sales nearest to the average sales for the period January to July?
Solution:
Average sale January to July =
= = 328.57
Then the average sale January to July is nearest sale of February(300).
 English
 100 Questions
 100 Marks
 90 Mins English English100 Questions100 Marks90 Mins English English40 Questions30 Marks25 Mins English
Suggested Test Series

Suggested Test Series