arrow
arrow
arrow
The given graph shows the percentage-wise distribution of different mobile phone models (A to F) produced by a mobile company in 2008 and 2009. The to
Question

The given graph shows the percentage-wise distribution of different mobile phone models (A to F) produced by a mobile company in 2008 and 2009. The total number of mobile phones produced in 2008 was 4,50,000 and that in 2009 was 6,40,000.

(If a value for any model in between a range, consider it to be at midpoint, e.g any point between 10 and 20 should be considered 15.)

What is the total number of mobile phones produced of models C, D and F in 2008?

A.

1,80,000

B.

1,35,000

C.

2,25,000

D.

2,02,500

Correct option is A

Given:

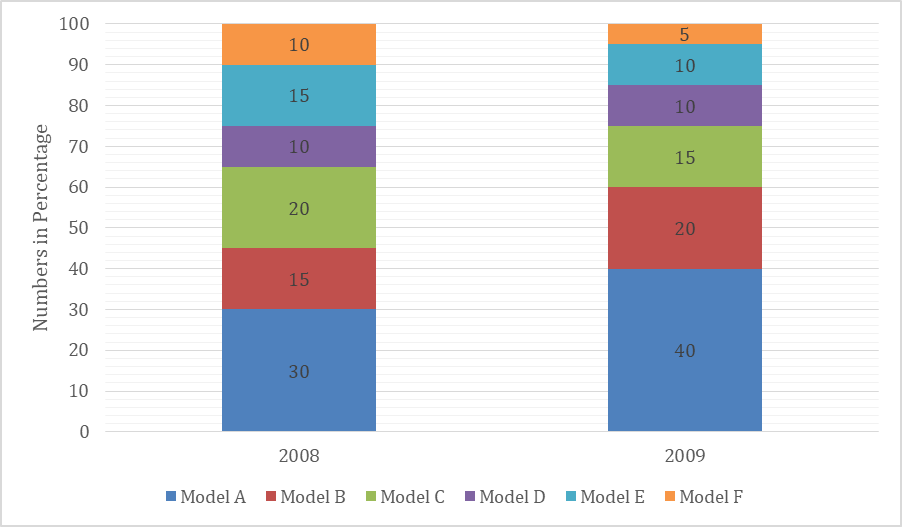
The total number of mobile phones produced in 2008 = 4,50,000.

Solution:

Model C = 20% in 2008

Model D = 10% in 2008

Model F = 10% in 2008

Total Model in 2018 = 40%

Total number of mobile phones produced of models C, D and F in 2008

4,50,000×40100=1,80,0004,50,000 \times \frac{40}{100} = 1,80,000​​

Free Tests

Free
Must Attempt

CBT-1 Full Mock Test 1

languageIcon English
  • pdpQsnIcon100 Questions
  • pdpsheetsIcon100 Marks
  • timerIcon90 Mins
languageIcon English
Free
Must Attempt

RRB NTPC Graduate Level PYP (Held on 5 Jun 2025 S1)

languageIcon English
  • pdpQsnIcon100 Questions
  • pdpsheetsIcon100 Marks
  • timerIcon90 Mins
languageIcon English
Free
Must Attempt

CBT-1 General Awareness Section Test 1

languageIcon English
  • pdpQsnIcon40 Questions
  • pdpsheetsIcon30 Marks
  • timerIcon25 Mins
languageIcon English

Similar Questions

test-prime-package

Access ‘RRB NTPC’ Mock Tests with

  • 60000+ Mocks and Previous Year Papers
  • Unlimited Re-Attempts
  • Personalised Report Card
  • 500% Refund on Final Selection
  • Largest Community
students-icon
353k+ students have already unlocked exclusive benefits with Test Prime!
Our Plans
Monthsup-arrow