arrow
arrow
arrow
The given graph shows the percentage of profit gained by two corporate bodies A and B from the year 2015 to 2018. If the expenditure of A was 60 lak
Question

The given graph shows the percentage of profit gained by two corporate bodies A and B from the year 2015 to 2018.
If the expenditure of A was 60 lakhs, then how much was the revenue (in 2) of A in 2018?

A.

65 lakh

B.

50 lakh

C.

99 lakh

D.

100 lakh

Correct option is C

Given:

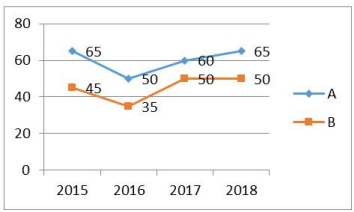
​Expenditure of A in 2018: 60 lakhs

​Profit percentage of A in 2018: 65%

Formula used:

calculate revenue-

Revenue=Expenditure+Profit

Profit percentage-

Profit = (Profit Percentage100)×Expenditure(\frac{Profit\ Percentage}{100}) \times Expenditure

Solution:

Profit = (65100)×60(\frac{65}{100}) \times 60 = 39 Lakhs

Now, calculate the revenue:

Revenue=60 lakhs+39 lakhs

99 lakhs

Therefore, the revenue of corporate body A in 2018 was 99 lakhs

Free Tests

Free
Must Attempt

CBT-1 Full Mock Test 1

languageIcon English
  • pdpQsnIcon100 Questions
  • pdpsheetsIcon100 Marks
  • timerIcon90 Mins
languageIcon English
Free
Must Attempt

RRB NTPC Graduate Level PYP (Held on 5 Jun 2025 S1)

languageIcon English
  • pdpQsnIcon100 Questions
  • pdpsheetsIcon100 Marks
  • timerIcon90 Mins
languageIcon English
Free
Must Attempt

CBT-1 General Awareness Section Test 1

languageIcon English
  • pdpQsnIcon40 Questions
  • pdpsheetsIcon30 Marks
  • timerIcon25 Mins
languageIcon English
test-prime-package

Access ‘RRB NTPC’ Mock Tests with

  • 60000+ Mocks and Previous Year Papers
  • Unlimited Re-Attempts
  • Personalised Report Card
  • 500% Refund on Final Selection
  • Largest Community
students-icon
353k+ students have already unlocked exclusive benefits with Test Prime!
Our Plans
Monthsup-arrow