arrow
arrow
arrow
The given graph shows rainfall in centimetres in the cities M, N, O and P from 2001 to 2005. Study the graph and answer the question. Whi
Question

The given graph shows rainfall in centimetres in the cities M, N, O and P from 2001 to 2005. Study the graph and answer the question.

Which city has the widest range of rainfall over 5 years?

A.

O

B.

P

C.

N

D.

M

Correct option is B

Solution:    

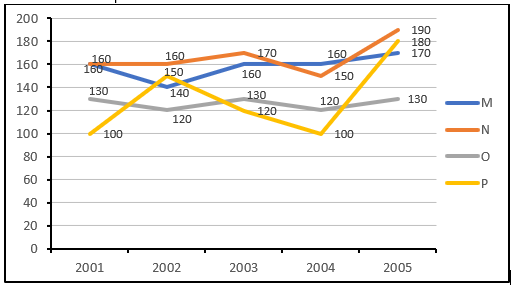
The following data represents the rainfall (in centimeters) for cities M, N, O, and P from 2001 to 2005:

M: 160, 140, 160, 160, 170

N: 160, 160, 170, 150, 190

O: 130, 120, 130, 120, 130

P: 100, 150, 120, 100, 180

To find the city with the maximum average rainfall, we calculate the average rainfall for each city as follows:

Range rainfall for   = 170 - 140 = 30 

Range rainfall for N = 150 - 190 = 40

Range rainfall for O   = 130 - 120 = 10 

Range rainfall for P = 180 - 100 = 80 

According to the calculating data City P has the widest range of rainfall over 5 years 

Free Tests

Free
Must Attempt

CBT-1 Full Mock Test 1

languageIcon English
  • pdpQsnIcon100 Questions
  • pdpsheetsIcon100 Marks
  • timerIcon90 Mins
languageIcon English
Free
Must Attempt

RRB NTPC Graduate Level PYP (Held on 5 Jun 2025 S1)

languageIcon English
  • pdpQsnIcon100 Questions
  • pdpsheetsIcon100 Marks
  • timerIcon90 Mins
languageIcon English
Free
Must Attempt

CBT-1 General Awareness Section Test 1

languageIcon English
  • pdpQsnIcon40 Questions
  • pdpsheetsIcon30 Marks
  • timerIcon25 Mins
languageIcon English

Similar Questions

test-prime-package

Access ‘RRB NTPC’ Mock Tests with

  • 60000+ Mocks and Previous Year Papers
  • Unlimited Re-Attempts
  • Personalised Report Card
  • 500% Refund on Final Selection
  • Largest Community
students-icon
354k+ students have already unlocked exclusive benefits with Test Prime!
Our Plans
Monthsup-arrow