Correct option is A
Given:
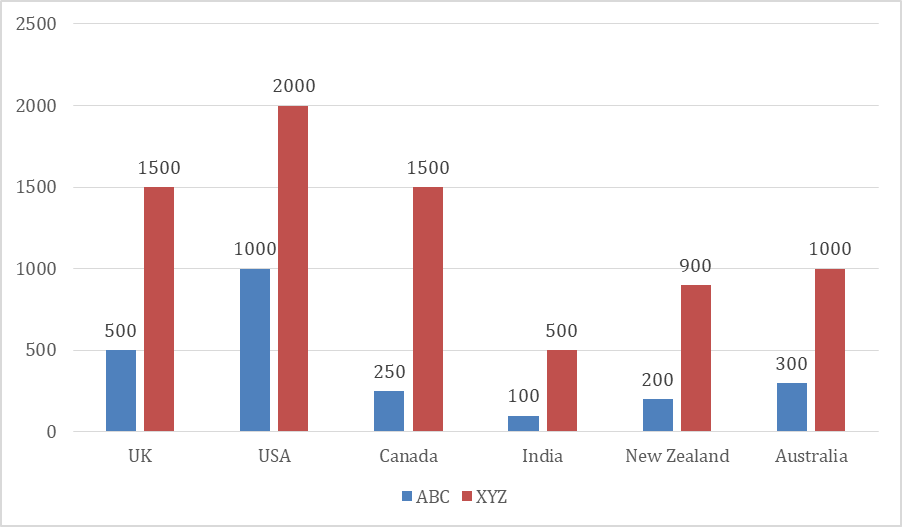
From the bar graph:
ABC Book Sales:
New Zealand = 200
India = 100
XYZ Book Sales:
New Zealand = 900
India = 500
Solution:
New Zealand total sales = 200 (ABC) + 900 (XYZ) = 1100
India total sales = 100 (ABC) + 500 (XYZ) = 600
Required Ratio =
 English
 100 Questions
 100 Marks
 90 Mins