arrow
arrow
arrow
The given bar graph shows the sales of bikes of two different companies in 6 different years. Study the graph and answer the question that follows.The
Question

The given bar graph shows the sales of bikes of two different companies in 6 different years. Study the graph and answer the question that follows.

The total bikes sold by company A in 2016 and 2020 together is approximately what percentage of the total bikes sold by both the companies in 2018?

A.

105%

B.

100%

C.

110%

D.

95%

Correct option is B

Given:

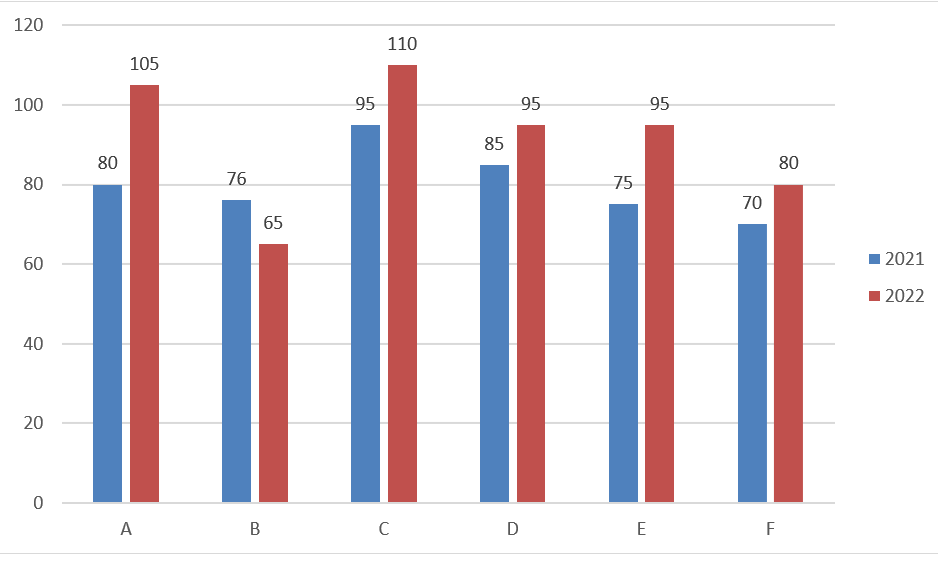
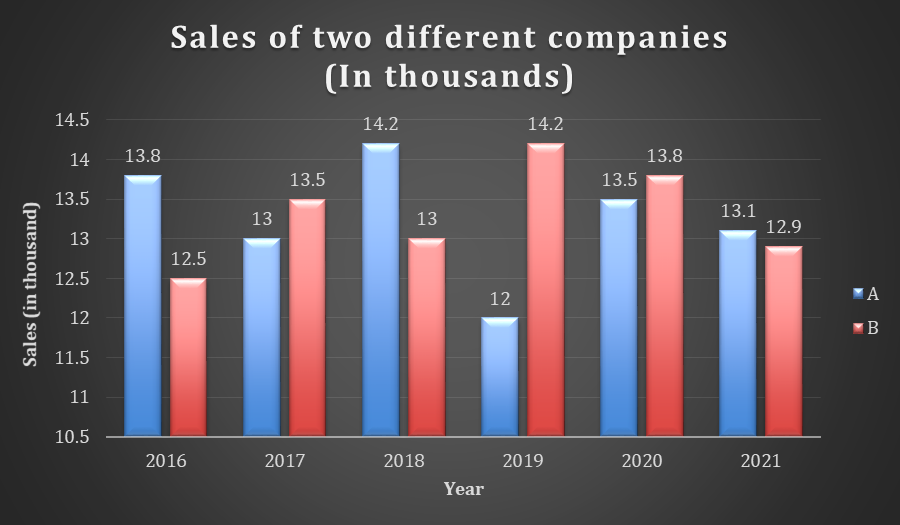
The sales of bikes of two different companies in 6 different years

Formula Used:

LCM is the smallest common number which is divisible by the given numbers without leaving any remainders

Solution:

Total bikes sold by company A in 2016 and 2020 = 13.8 +13.5 = 27.3

Total bikes sold by both company in 2018 = 14.2 + 13 = 27.2

Percentage  =27.327.2×100 \frac{27.3}{27.2} \times 100​ = 100%

Free Tests

Free
Must Attempt

CBT-1 Full Mock Test 1

languageIcon English
  • pdpQsnIcon100 Questions
  • pdpsheetsIcon100 Marks
  • timerIcon90 Mins
languageIcon English
Free
Must Attempt

RRB NTPC Graduate Level PYP (Held on 5 Jun 2025 S1)

languageIcon English
  • pdpQsnIcon100 Questions
  • pdpsheetsIcon100 Marks
  • timerIcon90 Mins
languageIcon English
Free
Must Attempt

RRB NTPC UG Level PYP (Held on 7 Aug 2025 S1)

languageIcon English
  • pdpQsnIcon100 Questions
  • pdpsheetsIcon100 Marks
  • timerIcon90 Mins
languageIcon English

Similar Questions

test-prime-package

Access ‘RRB Group D’ Mock Tests with

  • 60000+ Mocks and Previous Year Papers
  • Unlimited Re-Attempts
  • Personalised Report Card
  • 500% Refund on Final Selection
  • Largest Community
students-icon
368k+ students have already unlocked exclusive benefits with Test Prime!
Our Plans
Monthsup-arrow