arrow
arrow
arrow
The given bar graph shows the profit made by a software company (in Million $) from 2013 to 2018. The profit made by the company in 2017-1
Question

The given bar graph shows the profit made by a software company (in Million $) from 2013 to 2018.

The profit made by the company in 2017-18 was approximately what percentage of the average profit over the period under review which means 2013-18?

A.

200%

B.

85%

C.

90%

D.

107%

Correct option is D

Solution:

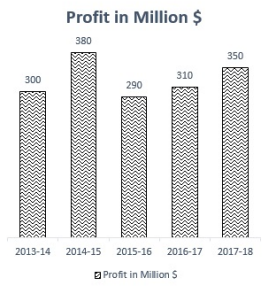
The profit made by the company in 2017-18 =350

The average profit over the period under review which means 2013-18= (300+380+290+310+350)/5=326

The profit made by the company in 2017-18 percentage of the average profit over the period  2013-18=350×100326\frac{350\times100}{326}=107%​

Free Tests

Free
Must Attempt

CBT-1 Full Mock Test 1

languageIcon English
  • pdpQsnIcon100 Questions
  • pdpsheetsIcon100 Marks
  • timerIcon90 Mins
languageIcon English
Free
Must Attempt

RRB NTPC Graduate Level PYP (Held on 5 Jun 2025 S1)

languageIcon English
  • pdpQsnIcon100 Questions
  • pdpsheetsIcon100 Marks
  • timerIcon90 Mins
languageIcon English
Free
Must Attempt

RRB NTPC UG Level PYP (Held on 7 Aug 2025 S1)

languageIcon English
  • pdpQsnIcon100 Questions
  • pdpsheetsIcon100 Marks
  • timerIcon90 Mins
languageIcon English

Similar Questions

TEST PRIME

Access ‘RRB NTPC’ Mock Tests with

  • 60000+ Mocks and Previous Year Papers
  • Unlimited Re-Attempts
  • Personalised Report Card
  • 500% Refund on Final Selection
  • Largest Community
1 month
students-icon
368k+ students have already unlocked exclusive benefits with Test Prime!
Our Plans
Monthsup-arrow