arrow
arrow
arrow
The given bar graph shows the percentage of production of three companies C1, C2 and C3 over five years. Study the bar graph and answer the question t
Question

The given bar graph shows the percentage of production of three companies C1, C2 and C3 over five years. Study the bar graph and answer the question that follows.

If the ratio of the total production in the year 2019 and 2022 is 3:5 and the total production in C1 in 2022 is 4125, then the total production of C3 in the year 2019 is:

A.

5175

B.

9000

C.

2250

D.

1575

Correct option is D

Given:
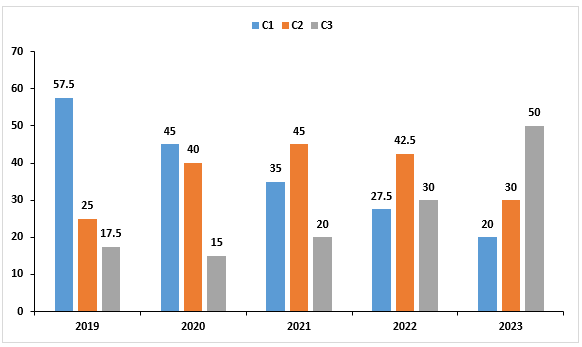
The percentage of production of three companies C1, C2 and C3 over five years
The ratio of the total production in the year 2019 and 2022 is 3:5
The total production in C1 in 2022 is 4125
Solution:
Percentage of total production of C1 in 2022 = 27.5%
Actual production of C1 = 4125
Total production of 2022:
412527.5×100=15,000\frac{ 4125}{27.5}× 100 = 15,000​​
Ratio of production in 2019 to 2022 =3:5
5= 15000
3= 150005×3=9000\frac{15000}{5} ×3 = 9000 ​ 
The total production in 2019 = 9000
Production of C3 = 17.5% of 9000 = 17.5100\frac{17.5}{100}​× 9000 = 1575

Free Tests

Free
Must Attempt

SSC GD PYP (Held on 4 Feb 2025 S1)

languageIcon English
  • pdpQsnIcon80 Questions
  • pdpsheetsIcon160 Marks
  • timerIcon60 Mins
languageIcon English
Free
Must Attempt

Hindi Section Test 1

languageIcon English
  • pdpQsnIcon20 Questions
  • pdpsheetsIcon40 Marks
  • timerIcon12 Mins
languageIcon English
Free
Must Attempt

SSC GD Constable Full Mock Test 1

languageIcon English
  • pdpQsnIcon80 Questions
  • pdpsheetsIcon160 Marks
  • timerIcon60 Mins
languageIcon English

Similar Questions

test-prime-package

Access ‘SSC CHSL Tier I’ Mock Tests with

  • 60000+ Mocks and Previous Year Papers
  • Unlimited Re-Attempts
  • Personalised Report Card
  • 500% Refund on Final Selection
  • Largest Community
students-icon
354k+ students have already unlocked exclusive benefits with Test Prime!
Our Plans
Monthsup-arrow