hamburger menu
All Coursesall course arrow
adda247
reward-icon
adda247
    arrow
    arrow
    arrow
    The given bar graph shows the number of students (in hundreds) graduated from 4 different departments of a university A, B, C and D during 3 consecuti
    Question

    The given bar graph shows the number of students (in hundreds) graduated from 4 different departments of a university A, B, C and D during 3 consecutive years.

    What is the average number of students graduated from all the departments (in hundreds) for the year 2017?

    A.

    100

    B.

    500

    C.

    420

    D.

    625

    Correct option is D

    Given:

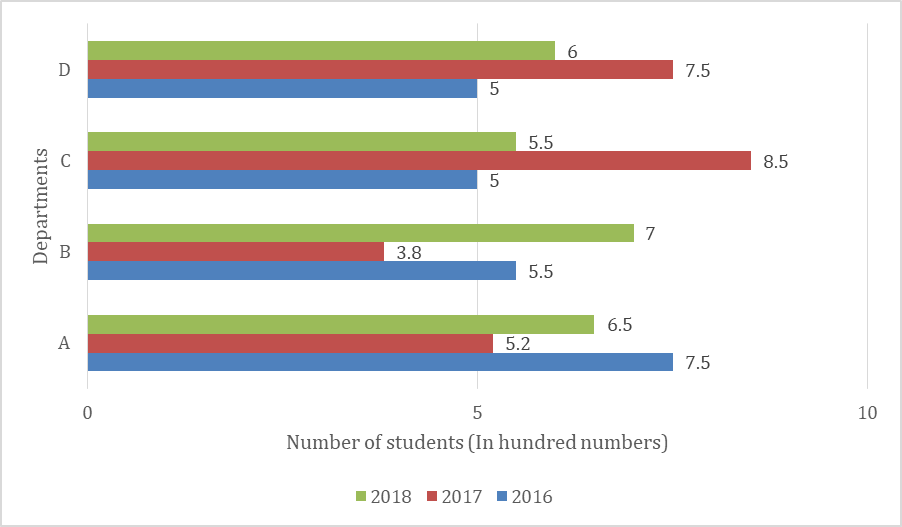
    The data for 2017 from the graph is as follows:

    Department A: 5.2

    Department B: 3.8

    Department C: 8.5

    Department D: 7.5

    Solution:

    Sum of students graduated in 2017 from all departments:

    5.2 + 3.8 + 8.5 + 7.5 = 25

    Average =254=6.2 \frac{25}{4} = 6.2​5 hundred students = 625 students

    Free Tests

    Free
    Must Attempt

    CBT-1 Full Mock Test 1

    languageIcon English
    • pdpQsnIcon100 Questions
    • pdpsheetsIcon100 Marks
    • timerIcon90 Mins
    languageIcon English
    Free
    Must Attempt

    RRB NTPC Graduate Level PYP (Held on 5 Jun 2025 S1)

    languageIcon English
    • pdpQsnIcon100 Questions
    • pdpsheetsIcon100 Marks
    • timerIcon90 Mins
    languageIcon English
    Free
    Must Attempt

    CBT-1 General Awareness Section Test 1

    languageIcon English
    • pdpQsnIcon40 Questions
    • pdpsheetsIcon30 Marks
    • timerIcon25 Mins
    languageIcon English

    Similar Questions

    test-prime-package

    Access ‘RRB NTPC’ Mock Tests with

    • 60000+ Mocks and Previous Year Papers
    • Unlimited Re-Attempts
    • Personalised Report Card
    • 500% Refund on Final Selection
    • Largest Community
    students-icon
    354k+ students have already unlocked exclusive benefits with Test Prime!
    Our Plans
    Monthsup-arrow