arrow
arrow
arrow
The given bar graph shows the data of the production of chocolates (in thousand tonne) by three branches X, Y and Z of a dairy product company.Wh
Question

The given bar graph shows the data of the production of chocolates (in thousand tonne) by three branches X, Y and Z of a dairy product company.

What is the ratio of the average production by branch X in the Years 3 to 5 to the average production by branch Y in the same period?

A.

3 : 04

B.

10 : 20

C.

25 : 30

D.

28 : 29

Correct option is D

Formula used:

AverageSum of all valueNumber of all value\frac{Sum\ of\ all\ value}{Number\ of\ all\ value} 

Solution: 

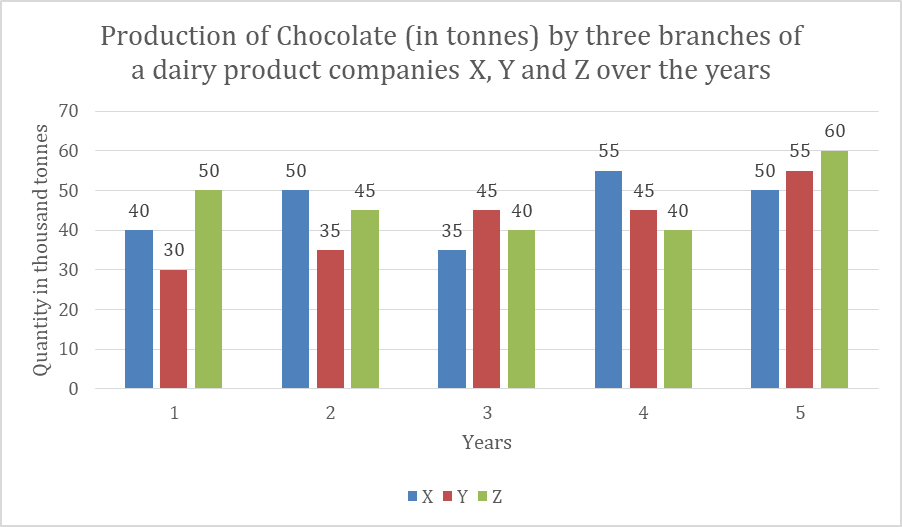
The production of company X in the year 3 to 5 is = 35 + 55+ 50 = 140 tonnes

Average = 1403\frac{140}{3} 

The production of company Y in the year 3 to 5 is = 45 + 45 + 55 = 145

Average = 1453\frac{145}{3}​​

The ratio of the average production by branch X and branch Y is = 1403×3145\frac{140}{3}×\frac{3}{145} = 28 : 29

Thus, the correct option is (D)

Free Tests

Free
Must Attempt

CBT-1 Full Mock Test 1

languageIcon English
  • pdpQsnIcon100 Questions
  • pdpsheetsIcon100 Marks
  • timerIcon90 Mins
languageIcon English
Free
Must Attempt

RRB NTPC Graduate Level PYP (Held on 5 Jun 2025 S1)

languageIcon English
  • pdpQsnIcon100 Questions
  • pdpsheetsIcon100 Marks
  • timerIcon90 Mins
languageIcon English
Free
Must Attempt

RRB NTPC UG Level PYP (Held on 7 Aug 2025 S1)

languageIcon English
  • pdpQsnIcon100 Questions
  • pdpsheetsIcon100 Marks
  • timerIcon90 Mins
languageIcon English

Similar Questions

test-prime-package

Access ‘RRB NTPC’ Mock Tests with

  • 60000+ Mocks and Previous Year Papers
  • Unlimited Re-Attempts
  • Personalised Report Card
  • 500% Refund on Final Selection
  • Largest Community
students-icon
368k+ students have already unlocked exclusive benefits with Test Prime!
Our Plans
Monthsup-arrow