arrow
arrow
arrow
The following table shows the production of tomatoes (in tons) for three different states, X. Y and Z. over the years 2016 to 2019. Based on the table
Question

The following table shows the production of tomatoes (in tons) for three different states, X. Y and Z. over the years 2016 to 2019. Based on the table answer the question given below

What is the average production of tomatoes (in tons) for state Y for all the years together?

A.

6 tons

B.

5 tons

C.

3 tons

D.

4 tons

Correct option is B

Formula Used:

Average = Sum of numbersTotal number \frac{Sum \ of\ numbers }{Total \ number}​​
Solution:

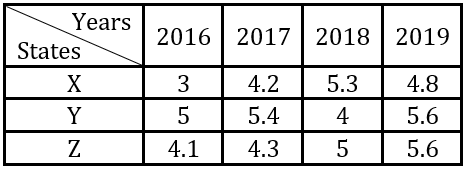
Production of tomatoes for state Y in 2016, 2017, 2018, and 2019 are 5, 5.4, 4, and 5.6 (in tons) respectively.
Average = Sum of numbersTotal number \frac{Sum \ of\ numbers }{Total \ number}

= (5+5.4+4+5.6)4\frac{(5 + 5.4 + 4 + 5.6) }{ 4}​​
= 20 / 4
= 5 tons
Thus, the required average value is 5 tons.

Free Tests

Free
Must Attempt

CBT-1 Full Mock Test 1

languageIcon English
  • pdpQsnIcon100 Questions
  • pdpsheetsIcon100 Marks
  • timerIcon90 Mins
languageIcon English
Free
Must Attempt

RRB NTPC Graduate Level PYP (Held on 5 Jun 2025 S1)

languageIcon English
  • pdpQsnIcon100 Questions
  • pdpsheetsIcon100 Marks
  • timerIcon90 Mins
languageIcon English
Free
Must Attempt

CBT-1 General Awareness Section Test 1

languageIcon English
  • pdpQsnIcon40 Questions
  • pdpsheetsIcon30 Marks
  • timerIcon25 Mins
languageIcon English

Similar Questions

test-prime-package

Access ‘RRB NTPC’ Mock Tests with

  • 60000+ Mocks and Previous Year Papers
  • Unlimited Re-Attempts
  • Personalised Report Card
  • 500% Refund on Final Selection
  • Largest Community
students-icon
354k+ students have already unlocked exclusive benefits with Test Prime!
Our Plans
Monthsup-arrow