arrow
arrow
arrow
The following table shows admitted students in an institute during the academic years 2015 to 2020 in different courses. Academic
Question

The following table shows admitted students in an institute during the academic years 2015 to 2020 in different courses.
Academic year
Engineering
Science
Arts
Management
2015
1200
850
450
240
2016
1362
821
525
275
2017
1351
870
624
286
2018
1409
921
615
293
2019
1421
931
795
300
2020
1400
950
750
320
Which of the following course had either a consistent growth or a consistent decline in the admissions from 2015 to 2020?

A.

Management

B.

Engineering

C.

Arts

D.

Science

Correct option is A

Given:
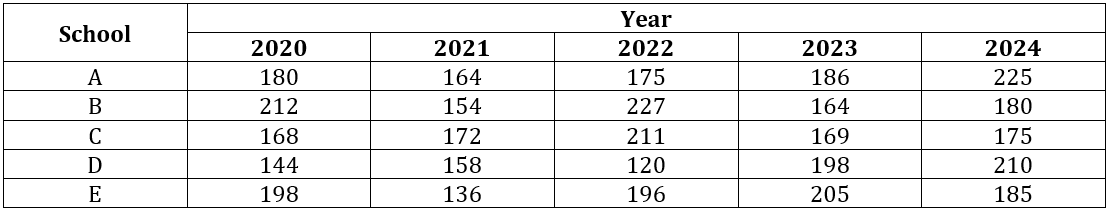
Admitted students in an institute during the academic years 2015 to 2020 in different courses
Solution:
Visual analysis of data in table clearly shows only in management course number of students admitted is only increasing over the years.

Free Tests

Free
Must Attempt

SSC GD PYP (Held on 4 Feb 2025 S1)

languageIcon English
  • pdpQsnIcon80 Questions
  • pdpsheetsIcon160 Marks
  • timerIcon60 Mins
languageIcon English
Free
Must Attempt

Hindi Section Test 1

languageIcon English
  • pdpQsnIcon20 Questions
  • pdpsheetsIcon40 Marks
  • timerIcon12 Mins
languageIcon English
Free
Must Attempt

SSC GD Constable Full Mock Test 1

languageIcon English
  • pdpQsnIcon80 Questions
  • pdpsheetsIcon160 Marks
  • timerIcon60 Mins
languageIcon English

Similar Questions

test-prime-package

Access ‘SSC CHSL Tier I’ Mock Tests with

  • 60000+ Mocks and Previous Year Papers
  • Unlimited Re-Attempts
  • Personalised Report Card
  • 500% Refund on Final Selection
  • Largest Community
students-icon
368k+ students have already unlocked exclusive benefits with Test Prime!
Our Plans
Monthsup-arrow