hamburger menu
All Coursesall course arrow
adda247
reward-icon
adda247
    arrow
    arrow
    arrow
    The following diagram is a combination of four figures, A, B, C and D. Figure A represents the number of people who drink green tea. Figure B represen
    Question

    The following diagram is a combination of four figures, A, B, C and D. Figure A represents the number of people who drink green tea. Figure B represents the number of people who drink cappuccino. Figure C represents the number of people who drink milk tea. Figure D represents the number of people who drink latte.
    How many people drink latte or cappuccino but not milk tea?

    A.

    23

    B.

    15

    C.

    11

    D.

    30

    Correct option is A

    Given: 
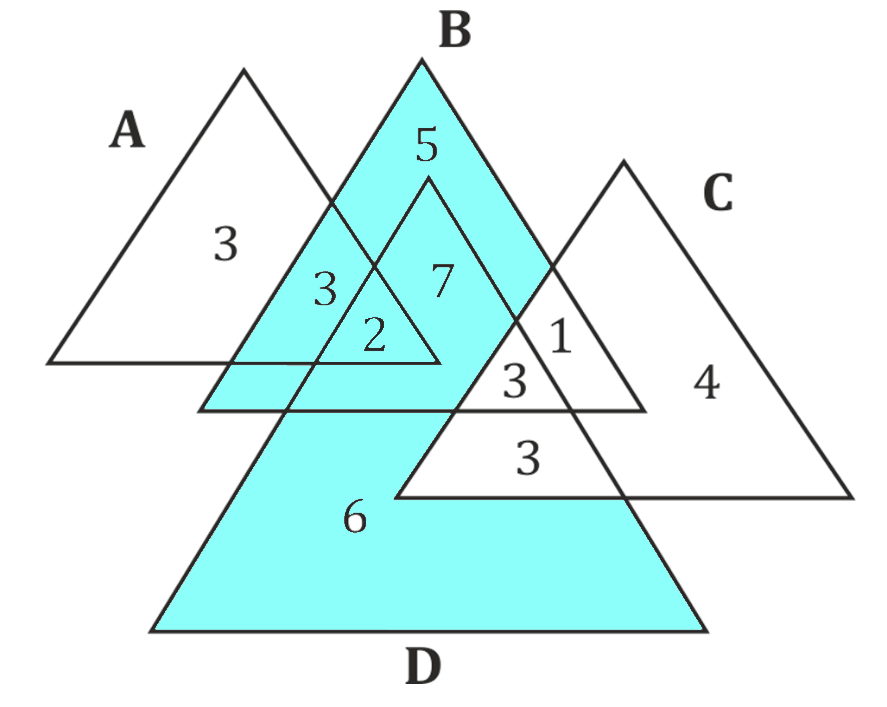
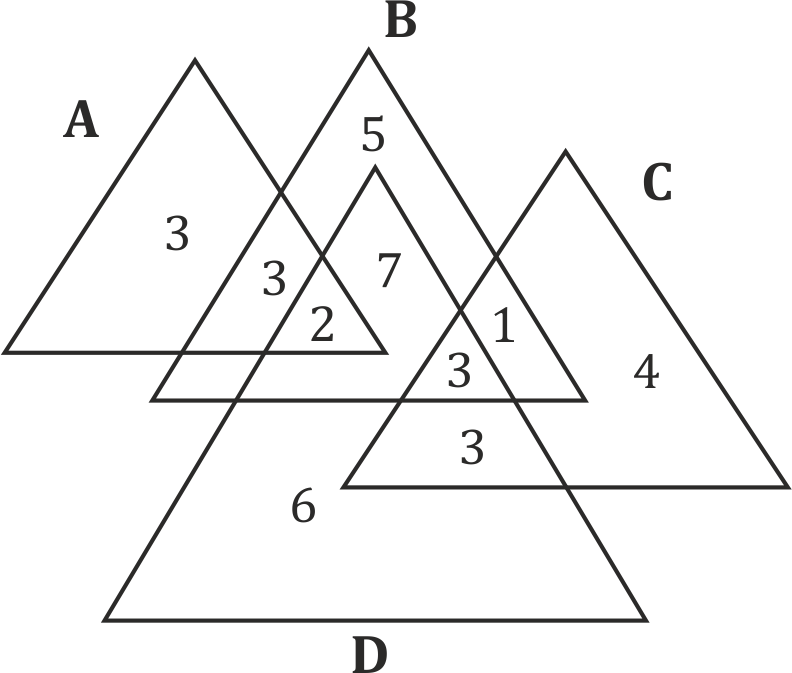
    Figure A → Green Tea drinkers
    Figure B → Cappuccino drinkers
    Figure C → Milk Tea drinkers
    Figure D → Latte drinkers
    People who drink latte or cappuccino but not milk tea = 5 + 3 + 7 + 2 + 6 = 23
    Thus, the Correct option is (a)

    Free Tests

    Free
    Must Attempt

    CBT-1 Full Mock Test 1

    languageIcon English
    • pdpQsnIcon100 Questions
    • pdpsheetsIcon100 Marks
    • timerIcon90 Mins
    languageIcon English
    Free
    Must Attempt

    RRB NTPC UG Level PYP (Held on 7 Aug 2025 S1)

    languageIcon English
    • pdpQsnIcon100 Questions
    • pdpsheetsIcon100 Marks
    • timerIcon90 Mins
    languageIcon English
    Free
    Must Attempt

    CBT-1 General Awareness Section Test 1

    languageIcon English
    • pdpQsnIcon40 Questions
    • pdpsheetsIcon30 Marks
    • timerIcon25 Mins
    languageIcon English

    Similar Questions

    test-prime-package

    Access ‘RRB NTPC’ Mock Tests with

    • 60000+ Mocks and Previous Year Papers
    • Unlimited Re-Attempts
    • Personalised Report Card
    • 500% Refund on Final Selection
    • Largest Community
    students-icon
    383k+ students have already unlocked exclusive benefits with Test Prime!
    Our Plans
    Monthsup-arrow