Correct option is B
Given:
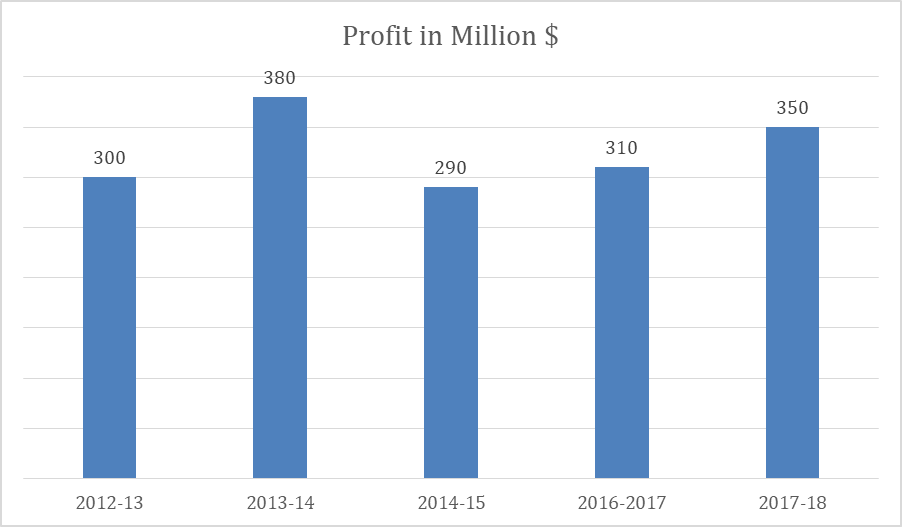
Maximum profit year = 2013-14 = 380
Minimum profit year = 2014-15 = 290
Formula Used:
Average =
Solution:
Maximum profit year = 2013-14 = 380
Minimum profit year = 2014-15 = 290
Average = = 326
For ,
= Maximum profit year - Average ,
= 380-326= 54,
For,
= Average - Minimum profit year
= 326-290 =36
Now, ratio
{(Average - Minimum profit year):(Maximum profit year - Average)}
= 36 : 54 = 2 : 3
 English
 100 Questions
 100 Marks
 90 Mins