arrow
arrow
arrow
The following bar graph shows the production of cotton (in tons) over the years. Study the graph and answer the question. What is the approximate pe
Question

The following bar graph shows the production of cotton (in tons) over the years. Study the graph and answer the question.

What is the approximate percentage increase in the production of cotton in 2020 as compared to 2017?

A.

26%

B.

30.50%

C.

28.12%

D.

25.05%

Correct option is C

Given: 

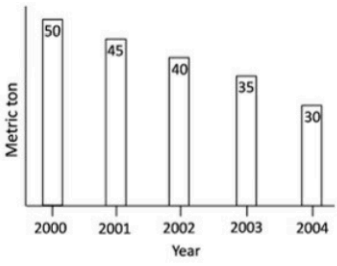
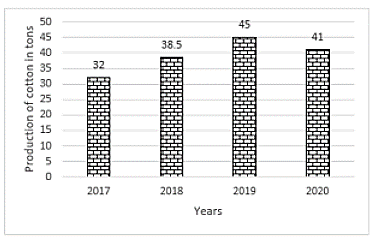
According to given bar graph,

the production of cotton in year 2017 is = 32 tons

And production of cotton in year 2020 is = 41 tons

Formula used:

Percentage Increase = New ValueOld ValueOld Value\frac{New\ Value- Old\ Value}{Old\ Value} ×100

Solution:

Put in the value in above formula

Percentage Increase = 413232\frac{41-32}{32} × 100 = 932\frac{9}{32} × 100 = 28.12%

Free Tests

Free
Must Attempt

CBT-1 Full Mock Test 1

languageIcon English
  • pdpQsnIcon100 Questions
  • pdpsheetsIcon100 Marks
  • timerIcon90 Mins
languageIcon English
Free
Must Attempt

RRB NTPC Graduate Level PYP (Held on 5 Jun 2025 S1)

languageIcon English
  • pdpQsnIcon100 Questions
  • pdpsheetsIcon100 Marks
  • timerIcon90 Mins
languageIcon English
Free
Must Attempt

CBT-1 General Awareness Section Test 1

languageIcon English
  • pdpQsnIcon40 Questions
  • pdpsheetsIcon30 Marks
  • timerIcon25 Mins
languageIcon English

Similar Questions

test-prime-package

Access ‘RRB Group D’ Mock Tests with

  • 60000+ Mocks and Previous Year Papers
  • Unlimited Re-Attempts
  • Personalised Report Card
  • 500% Refund on Final Selection
  • Largest Community
students-icon
354k+ students have already unlocked exclusive benefits with Test Prime!
Our Plans
Monthsup-arrow