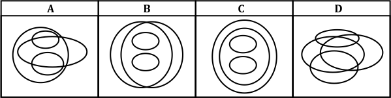
Correct option is A
Concept:
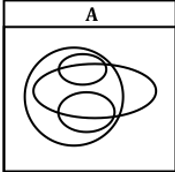
A
Venn diagram is a type of chart with
overlapping circles that indicates how much different groups have in common. A way to visualize relationships between different groups, known as sets.
Here's a basic way how a Venn Diagram works:
· Each
set of elements or event is represented as a circle or other shape.
·
If elements belong to more than one set, the shapes are overlapped. For example, if you have two sets A and B, then the intersection of these sets (those elements that belong to both A and B) are represented by the area where the circles overlap.
· Sometimes, a
rectangle is drawn around the whole diagram to represent the universal set, which includes all the elements under consideration.
· The
areas where circles interact or overlap represent all the possible logical relations between the sets.
Solution:
· Draw a large circle and label it as "PLAYERS." This circle contains all individuals who fall into the category of playing any type of sport.
· Within the "PLAYERS" circle, draw two smaller circles that don't intersect and label one as "FEMALE CRICKETERS" and the other as "MALE FOOTBALLERS". The fact that these two circles are mutually exclusive represents the fact that a person cannot be both a female cricketer and a male footballer.
· Finally, draw a separate large circle intersecting with the "PLAYERS" circle and label it as "GRADUATES". This circle will also overlap the "FEMALE CRICKETERS" and "MALE FOOTBALLERS" circles (because they are subsets of the "PLAYERS" circle).